【Python教學】繪製儀錶板圖
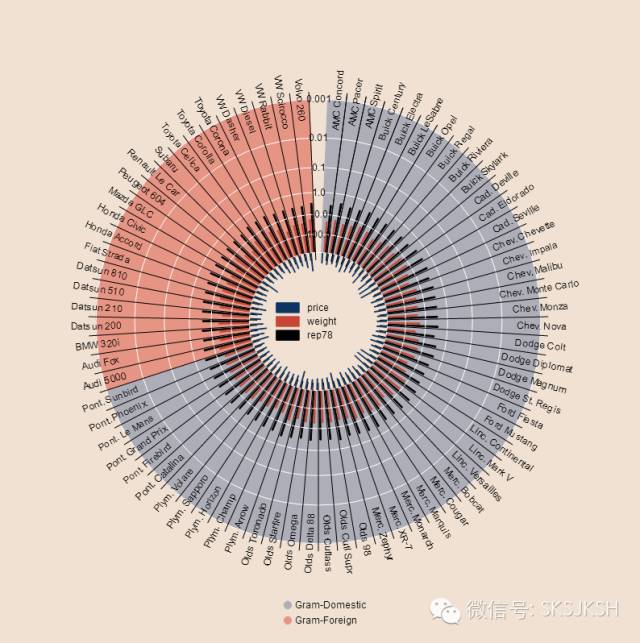
Bokeh(Bokeh.js)是一个可在Python中提供交互式的可视化库,其支持Web浏览器,并提供类似于D3.js软件一样的完美展示功能。本文简单介绍如何使用该程序库绘制仪表盘图,具体操作如下:
导入命令
1)设置工作环境
%cd "F:\\Dropbox\\python"
2)导入程序包
import matplotlib.pyplot as plt
import numpy as np
from matplotlib.image import BboxImage
from matplotlib._png import read_png
import matplotlib.colors
from matplotlib.cbook import get_sample_data
from collections import OrderedDict
from math import log, sqrt
import numpy as np
import pandas as pd
from bokeh.plotting import figure, show, output_file
3)读取数据
df =pd.read_csv("stata_auto.csv" )4)定义参数并绘制图像
drug_color = OrderedDict([
("price", "#0d3362"),
("weight", "#c64737"),
("rep78", "black" ),
])
gram_color = {
"Domestic" : "#aeaeb8",
"Foreign" : "#e69584",
}
width = 800
height = 800
inner_radius = 90
outer_radius = 300 - 10
minr = sqrt(log(.001 * 1E4))
maxr = sqrt(log(1000 * 1E4))
a = (outer_radius - inner_radius) / (minr - maxr)
b = inner_radius - a * maxr
def rad(mic):
return a * np.sqrt(np.log(mic * 1E4)) + b
big_angle = 2.0 * np.pi / (len(df) + 1)
small_angle = big_angle / 7
x = np.zeros(len(df))
y = np.zeros(len(df))
output_file("burtin.html", title="burtin.py example")
p = figure(plot_width=width, plot_height=height, title="",
x_axis_type=None, y_axis_type=None,
x_range=[-420, 420], y_range=[-420, 420],
min_border=0, outline_line_color="black",
background_fill="#f0e1d2", border_fill="#f0e1d2")
p.line(x+1, y+1, alpha=0)
angles = np.pi/2 - big_angle/2 - df.index.to_series()*big_angle
colors = [gram_color[gram] for gram in df.foreign]
p.annular_wedge(
x, y, inner_radius, outer_radius, -big_angle+angles, angles, color=colors,
)
p.annular_wedge(x, y, inner_radius, rad(df.price),
-big_angle+angles+5*small_angle, -big_angle+angles+6*small_angle,
color=drug_color['price'])
p.annular_wedge(x, y, inner_radius, rad(df.mpg),
-big_angle+angles+3*small_angle, -big_angle+angles+4*small_angle,
color=drug_color['weight'])
p.annular_wedge(x, y, inner_radius, rad(df.gear_ratio),
-big_angle+angles+1*small_angle, -big_angle+angles+2*small_angle,
color=drug_color['rep78'])
labels = np.power(10.0, np.arange(-3, 4))
radii = a * np.sqrt(np.log(labels * 1E4)) + b
p.circle(x, y, radius=radii, fill_color=None, line_color="white")
p.text(x[:-1], radii[:-1], [str(r) for r in labels[:-1]],
text_font_size="8pt", text_align="center", text_baseline="middle")
p.annular_wedge(x, y, inner_radius-10, outer_radius+10,
-big_angle+angles, -big_angle+angles, color="black")
xr = radii[0]*np.cos(np.array(-big_angle/2 + angles))
yr = radii[0]*np.sin(np.array(-big_angle/2 + angles))
label_angle=np.array(-big_angle/2+angles)
label_angle[label_angle < -np.pi/2] += np.pi # easier to read labels on the left side
p.text(xr, yr, df.make, angle=label_angle,
text_font_size="9pt", text_align="center", text_baseline="middle")
p.circle([-40, -40], [-370, -390], color=list(gram_color.values()), radius=5)
p.text([-30, -30], [-370, -390], text=["Gram-" + gr for gr in gram_color.keys()],
text_font_size="7pt", text_align="left", text_baseline="middle")
p.rect([-40, -40, -40], [18, 0, -18], width=30, height=13,
color=list(drug_color.values()))
p.text([-15, -15, -15], [18, 0, -18], text=list(drug_color.keys()),
text_font_size="9pt", text_align="left", text_baseline="middle")
p.xgrid.grid_line_color = None
p.ygrid.grid_line_color = None
show(p)输出图像如下

以上就是【Python教程】绘制仪表盘图的内容,更多相关内容请关注PHP中文网(www.php.cn)!

熱AI工具

Undresser.AI Undress
人工智慧驅動的應用程序,用於創建逼真的裸體照片

AI Clothes Remover
用於從照片中去除衣服的線上人工智慧工具。

Undress AI Tool
免費脫衣圖片

Clothoff.io
AI脫衣器

Video Face Swap
使用我們完全免費的人工智慧換臉工具,輕鬆在任何影片中換臉!

熱門文章

熱工具

記事本++7.3.1
好用且免費的程式碼編輯器

SublimeText3漢化版
中文版,非常好用

禪工作室 13.0.1
強大的PHP整合開發環境

Dreamweaver CS6
視覺化網頁開發工具

SublimeText3 Mac版
神級程式碼編輯軟體(SublimeText3)
 PHP和Python:解釋了不同的範例
Apr 18, 2025 am 12:26 AM
PHP主要是過程式編程,但也支持面向對象編程(OOP);Python支持多種範式,包括OOP、函數式和過程式編程。 PHP適合web開發,Python適用於多種應用,如數據分析和機器學習。
 在PHP和Python之間進行選擇:指南
Apr 18, 2025 am 12:24 AM
PHP適合網頁開發和快速原型開發,Python適用於數據科學和機器學習。 1.PHP用於動態網頁開發,語法簡單,適合快速開發。 2.Python語法簡潔,適用於多領域,庫生態系統強大。
 sublime怎麼運行代碼python
Apr 16, 2025 am 08:48 AM
在 Sublime Text 中運行 Python 代碼,需先安裝 Python 插件,再創建 .py 文件並編寫代碼,最後按 Ctrl B 運行代碼,輸出會在控制台中顯示。
 PHP和Python:深入了解他們的歷史
Apr 18, 2025 am 12:25 AM
PHP起源於1994年,由RasmusLerdorf開發,最初用於跟踪網站訪問者,逐漸演變為服務器端腳本語言,廣泛應用於網頁開發。 Python由GuidovanRossum於1980年代末開發,1991年首次發布,強調代碼可讀性和簡潔性,適用於科學計算、數據分析等領域。
 Python vs. JavaScript:學習曲線和易用性
Apr 16, 2025 am 12:12 AM
Python更適合初學者,學習曲線平緩,語法簡潔;JavaScript適合前端開發,學習曲線較陡,語法靈活。 1.Python語法直觀,適用於數據科學和後端開發。 2.JavaScript靈活,廣泛用於前端和服務器端編程。
 Golang vs. Python:性能和可伸縮性
Apr 19, 2025 am 12:18 AM
Golang在性能和可擴展性方面優於Python。 1)Golang的編譯型特性和高效並發模型使其在高並發場景下表現出色。 2)Python作為解釋型語言,執行速度較慢,但通過工具如Cython可優化性能。
 vscode在哪寫代碼
Apr 15, 2025 pm 09:54 PM
在 Visual Studio Code(VSCode)中編寫代碼簡單易行,只需安裝 VSCode、創建項目、選擇語言、創建文件、編寫代碼、保存並運行即可。 VSCode 的優點包括跨平台、免費開源、強大功能、擴展豐富,以及輕量快速。
 notepad 怎麼運行python
Apr 16, 2025 pm 07:33 PM
在 Notepad 中運行 Python 代碼需要安裝 Python 可執行文件和 NppExec 插件。安裝 Python 並為其添加 PATH 後,在 NppExec 插件中配置命令為“python”、參數為“{CURRENT_DIRECTORY}{FILE_NAME}”,即可在 Notepad 中通過快捷鍵“F6”運行 Python 代碼。


