詳解HTML5網路拓樸圖整合OpenLayers實現GIS地圖應用(圖)
HT for Web作為邏輯拓樸圖形元件本身沒有GIS功能,但可以與各種GIS引擎即其客戶端元件進行融合,各取所長實現邏輯拓撲和物理拓撲的無縫融合,本章將具體介紹HT for Web與開發免費的OpenLayers地圖結合應用的關鍵技術點,該文介紹的結合的原理,其實還可推廣到與ArcGIS、百度地圖以及GoogleMap等眾多GIS地圖引擎融合的解決方案。

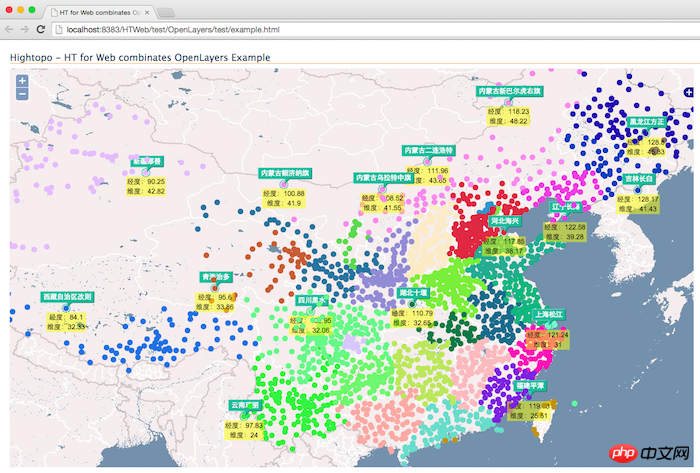
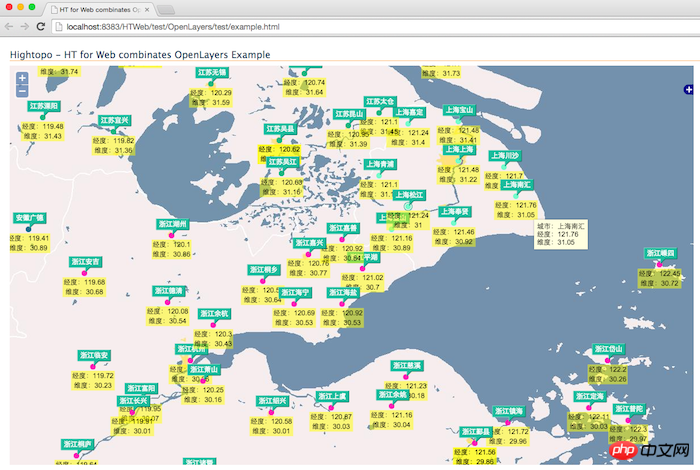
以上抓圖為本文介紹的例子最終運行效果,接下來我們一步步來實現,首選顯示地圖資訊需要有城市經緯度數據,搜尋了下感謝此篇部落格提供的資料。這麼大量的數據我採用的是《HT圖形元件設計之道(四)》中介紹的getRawText函數方式,有了數據之後剩下就是呈現的問題了,我們需要將HT的GraphView元件與OpenLayers的map地圖元件疊在一起,也就是OpenLayers的tile地圖圖片在下方,GraphView的元件在上方,由於GraphView預設是透明的,因此非圖元部分使用者可穿透看到地圖內容。找到合適的組件插入位置是頭痛的事情,ArcGIS、百度地圖包括GoogleMap幾乎每個不同的GIS組件都需要嘗試一番才能找到合適的插入位置,其他GIS引擎組件的整合以後章節再介紹,本文我們關注的OpenLayers的插入方式為map.viewPortp.appendChild(graphView.getView())。
HT和OpenLayers元件疊加在一起之後,剩下就是拓樸裡面圖元的擺放位置與經緯度結合的問題,常規網路拓撲圖中儲存在ht.Node圖元的position是邏輯位置,和經緯度沒有任何關係,因此在GIS應用中我們需要根據圖元的經緯度信息換算出position的屏幕邏輯坐標信息,如果你知道投影算法也可以自己提供函數處理,但所有GIS組件都提供了類似的API函數供調用,當然這部分也沒有標準化,不同的GIS元件需要調用的API都有差異,但基本原理是一致的,對於OpenLayers我們透過map.getPixelFromLonLat(data.lonLat)可以將經緯度資訊轉換成螢幕像素邏輯座標,也就是ht.Node需要的position座標資訊。
細心的同學會想到轉換是雙向的,有可能使用者需要拖曳圖元節點改變其經緯度訊息,這時候我們就需要另外一個方向函數,即根據螢幕邏輯座標轉換成當前座標對應的經緯度,在OpenLayers中我們透過map.getLonLatFromPixel(new OpenLayers.Pixel(x, y));可以搞定。
顯示搞定後剩下就是交互的問題了,HT自己有套交互體系,OpenLayers也需要地圖漫遊和縮放的交互,兩者如何結合呢?如果能保留住兩者的功能那就最好了,答案時肯定的,我們只需要添加mousedown或touchstart事件監聽,如果graphView.getDataAt(e)選中了圖元我們就通過e.stopPropagation();停止事件的傳播,這樣map地圖就不會響應,這時候HT接管了交互,如果沒有選中圖元則map接管地圖操作的交互。
以上互動設計似乎很完美了,結果運行時發現了幾個折騰了我很久才找到解決方案的坑:
設定map.events.fallThrough = true;否則map不會將事件透傳到HT的GraphView元件
graphView.getView().style.zIndex = 999; 需要指定一定的zIndex否則會被遮蔽
graphView.getView().className = 'olScrollable'; 否則滾輪不會回應地圖縮放
設定ht.Default.baseZIndex: 1000否則ToolTip會被遮蔽
為了讓這個範例使用者體驗更友好,我還用心折騰了些技術點供參考:
- ##採用開源免費的llllll.li/randomColor/隨機顏色類別庫,該類別庫還有很多非常棒的顏色獲取函數,我只是簡單的為每個省份顯示不一樣的顏色
- 重載了isVisible、isNoteVisible和isLabelVisible僅在縮放達到一定等級才顯示更詳細的內容,否則縮小時所有城市資訊都顯示完全無法查看,多少也能提高顯示效能


function init(){
graphView = new ht.graph.GraphView();
var view = graphView.getView();
map = new OpenLayers.Map("map");
var ol_wms = new OpenLayers.Layer.WMS(
"OpenLayers WMS",
"http://vmap0.tiles.osgeo.org/wms/vmap0",
{layers: "basic"}
);
map.addLayers([ol_wms]);
map.addControl(new OpenLayers.Control.LayerSwitcher());
map.zoomToMaxExtent();
map.events.fallThrough = true;
map.zoomToProxy = map.zoomTo;
map.zoomTo = function (zoom,xy){
view.style.opacity = 0;
map.zoomToProxy(zoom, xy);
console.log(zoom);
};
map.events.register("movestart", this, function() {
});
map.events.register("move", this, function() {
});
map.events.register("moveend", this, function() {
view.style.opacity = 1;
reset();
});
graphView.getView().className = 'olScrollable';
graphView.setScrollBarVisible(false);
graphView.setAutoScrollZone(-1);
graphView.handleScroll = function(){};
graphView.handlePinch = function(){};
graphView.mi(function(e){
if(e.kind === 'endMove'){
graphView.sm().each(function(data){
if(data instanceof ht.Node){
var position = data.getPosition(),
x = position.x + graphView.tx(),
y = position.y + graphView.ty();
data.lonLat = map.getLonLatFromPixel(new OpenLayers.Pixel(x, y));
}
});
}
});
graphView.enableToolTip();
graphView.getToolTip = function(event){
var data = this.getDataAt(event);
if(data){
return '城市:' + data.s('note') + '
经度:' + data.lonLat.lon + '
维度:' + data.lonLat.lat;
}
return null;
};
graphView.isVisible = function(data){
return map.zoom > 1 || this.isSelected(data);
};
graphView.isNoteVisible = function(data){
return map.zoom > 6 || this.isSelected(data);
};
graphView.getLabel = function(data){
return '经度:' + data.lonLat.lon + '\n维度:' + data.lonLat.lat;
};
graphView.isLabelVisible = function(data){
return map.zoom > 7 || this.isSelected(data);
};
view.addEventListener("ontouchend" in document ? 'touchstart' : 'mousedown', function(e){
var data = graphView.getDataAt(e);
if(data || e.metaKey || e.ctrlKey){
e.stopPropagation();
}
}, false);
view.style.position = 'absolute';
view.style.top = '0';
view.style.left = '0';
view.style.right = '0';
view.style.bottom = '0';
view.style.zIndex = 999;
map.viewPortp.appendChild(view);
var color = randomColor();
lines = china.split('\n');
for(var i=0; i<lines.length; i++) {
line = lines[i].trim();
if(line.indexOf('【') === 0){
//province = line.substring(1, line.length-1);
color = randomColor();
}else{
var ss = line.split(' ');
if(ss.length === 3){
createNode(parseFloat(ss[1].substr(3)), parseFloat(ss[2].substr(3)), ss[0].substr(3), color);
}
}
}
}
function reset(){
graphView.tx(0);
graphView.ty(0);
graphView.dm().each(function(data){
if(data.lonLat){
data.setPosition(map.getPixelFromLonLat(data.lonLat));
}
});
graphView.validate();
}
function createNode(lon, lat, name, color){
var node = new ht.Node();
node.s({
'shape': 'circle',
'shape.background': color,
'note': name,
'label.background': 'rgba(255, 255, 0, 0.5)',
'select.type': 'circle'
});
node.setSize(10, 10);
var lonLat = new OpenLayers.LonLat(lon, lat);
lonLat.transform('EPSG:4326', map.getProjectionObject());
node.setPosition(map.getPixelFromLonLat(lonLat));
node.lonLat = lonLat;
graphView.dm().add(node);
return node;
}以上是詳解HTML5網路拓樸圖整合OpenLayers實現GIS地圖應用(圖)的詳細內容。更多資訊請關注PHP中文網其他相關文章!

熱AI工具

Undresser.AI Undress
人工智慧驅動的應用程序,用於創建逼真的裸體照片

AI Clothes Remover
用於從照片中去除衣服的線上人工智慧工具。

Undress AI Tool
免費脫衣圖片

Clothoff.io
AI脫衣器

Video Face Swap
使用我們完全免費的人工智慧換臉工具,輕鬆在任何影片中換臉!

熱門文章

熱工具

記事本++7.3.1
好用且免費的程式碼編輯器

SublimeText3漢化版
中文版,非常好用

禪工作室 13.0.1
強大的PHP整合開發環境

Dreamweaver CS6
視覺化網頁開發工具

SublimeText3 Mac版
神級程式碼編輯軟體(SublimeText3)


