

echart插件等基本使用介紹
這篇文章主要介紹了echart簡介,小編覺得蠻不錯的,現在分享給大家,也給大家做個參考。一起跟著小編過來看看吧
1. 插件的下載
以下是ECharts的下載鏈接,需要注意的是ECharts內部也是依賴於另一個插件的叫ZRender,當然對於大部分圖表而言不需要ZRender的,但是對於地圖控件及其他複雜的呈現控件而已都是需要ZRender的。為了避免不要的問題出現,建議大家在下載ECharts時同時也要下載ZRender。
ECharts下載網址: http://echarts.baidu.com/
ZRender下載網址:http://ecomfe.github.io/zrender/index. html
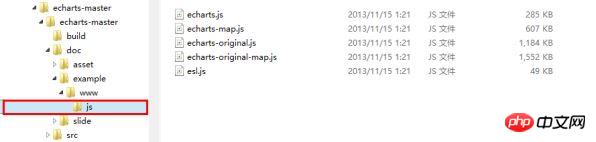
下載後解壓縮各自的檔案目錄結構如下:
ECharts:
 ##
##
# ZRender:

2. 外掛程式的引用

- 所有的跟ECharts有關的檔案全部都在echarts資料夾下
- echarts資料夾的內容分為兩部分

3. 在頁面中的具體使用
MapChart
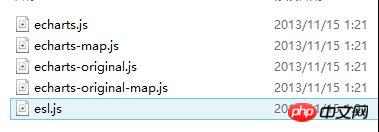
在head標籤中加入echarts的參考如下:
<head runat="server">
  <title></title>
  <script src="echarts/esl.js" type="text/javascript"></script>
</head>
<body>

<p id="main"style="height:500px;border:1px solid #ccc;padding:10px;"></p>

……………

……………

</body>
<script type="text/javascript">
//为模块加载器配置echarts的路径,这里主要是配置map图表的路径,其他的图表跟map的配置还不太一样,下边也会做另一种类型的图表事例。
这里引用的主要是echarts文件夹下的echarts-map文件,而其他类型的图表引用的都是echarts文件夹下的echarts文件。
require.config({
paths: {
echarts:'./echarts/echarts',
'echarts/chart/map':'./echarts/echarts-map'
}
});
//动态加载echarts,在回掉函数中使用,要注意保持按需加载结构定义图表路径
require(
[
'echarts',
'echarts/chart/map'
],
function (ec) {
varmyChart=ecinit(documentgetElementById('main'));
//option主要是图标的一些设置,这不是这篇文章的重点,关于具体的设置可以参考官方的文档说明文档
option= {
title: {
text:'iphone销量',
subtext:'纯属虚构',
x:'center'
},
tooltip: {
trigger:'item'
},
legend: {
orient:'vertical',
x:'left',
data: ['iphone3','iphone4','iphone5']
},
dataRange: {
min:0,
max:2500,
text: ['高','低'],
calculable:true,
textStyle: {
color:'orange'
}
},
toolbox: {
show:true,
orient:'vertical',
x:'right',
y:'center',
feature: {
mark:true,
dataView: { readOnly:false },
restore:true,
saveAsImage:true
}
},
series: [
{
name:'iphone3',
type:'map',
mapType:'china',
selectedMode: 'single',
itemStyle: {
normal: { label: { show:true },color:'#ffd700' },// for legend
emphasis: { label: { show:true} }
},
data: [
{ name:'北京',value:Math.round(Math.random() *1000) },
{ name:'天津',value:Math.round(Math.random() *1000) },
{ name:'上海',value:Math.round(Math.random() *1000) },
{ name:'重庆',value:Math.round(Math.random() *1000) },
{ name:'河北',value:Math.round(Math.random() *1000) },
{ name:'河南',value:Math.round(Math.random() *1000) },
{ name:'云南',value:Math.round(Math.random() *1000) },
{ name:'辽宁',value:Math.round(Math.random() *1000) },
{ name:'黑龙江',value:Math.round(Math.random() *1000) },
{ name:'湖南',value:Math.round(Math.random() *1000) },
{ name:'安徽',value:Math.round(Math.random() *1000) },
{ name:'山东',value:Math.round(Math.random() *1000) },
{ name:'新疆',value:Math.round(Math.random() *1000) },
{ name:'江苏',value:Math.round(Math.random() *1000) },
{ name:'浙江',value:Math.round(Math.random() *1000) },
{ name:'江西',value:Math.round(Math.random() *1000) },
{ name:'湖北',value:Math.round(Math.random() *1000) },
{ name:'广西',value:Math.round(Math.random() *1000) },
{ name:'甘肃',value:Math.round(Math.random() *1000) },
{ name:'山西',value:Math.round(Math.random() *1000) },
{ name:'内蒙古',value:Math.round(Math.random() *1000) },
{ name:'陕西',value:Math.round(Math.random() *1000) },
{ name:'吉林',value:Math.round(Math.random() *1000) },
{ name:'福建',value:Math.round(Math.random() *1000) },
{ name:'贵州',value:Math.round(Math.random() *1000) },
{ name:'广东',value:Math.round(Math.random() *1000) },
{ name:'青海',value:Math.round(Math.random() *1000) },
{ name:'西藏',value:Math.round(Math.random() *1000) },
{ name:'四川',value:Math.round(Math.random() *1000) },
{ name:'宁夏',value:Math.round(Math.random() *1000) },
{ name:'海南',value:Math.round(Math.random() *1000) },
{ name:'台湾',value:Math.round(Math.random() *1000) },
{ name:'香港',value:Math.round(Math.random() *1000) },
{ name:'澳门',value:Math.round(Math.random() *1000) }
]
},
{
name:'iphone4',
type:'map',
mapType:'china',
selectedMode: 'single',
itemStyle: {
normal: { label: { show:true },color:'#ff8c00' },// for legend
emphasis: { label: { show:true} }
},
data: [
{ name:'北京',value:Math.round(Math.random() *1000) },
{ name:'天津',value:Math.round(Math.random() *1000) },
{ name:'上海',value:Math.round(Math.random() *1000) },
{ name:'重庆',value:Math.round(Math.random() *1000) },
{ name:'河北',value:Math.round(Math.random() *1000) },
{ name:'安徽',value:Math.round(Math.random() *1000) },
{ name:'新疆',value:Math.round(Math.random() *1000) },
{ name:'浙江',value:Math.round(Math.random() *1000) },
{ name:'江西',value:Math.round(Math.random() *1000) },
{ name:'山西',value:Math.round(Math.random() *1000) },
{ name:'内蒙古',value:Math.round(Math.random() *1000) },
{ name:'吉林',value:Math.round(Math.random() *1000) },
{ name:'福建',value:Math.round(Math.random() *1000) },
{ name:'广东',value:Math.round(Math.random() *1000) },
{ name:'西藏',value:Math.round(Math.random() *1000) },
{ name:'四川',value:Math.round(Math.random() *1000) },
{ name:'宁夏',value:Math.round(Math.random() *1000) },
{ name:'香港',value:Math.round(Math.random() *1000) },
{ name:'澳门',value:Math.round(Math.random() *1000) }
]
},
{
name:'iphone5',
type:'map',
mapType:'china',
selectedMode: 'single',
itemStyle: {
normal: { label: { show:true },color:'#da70d6' },// for legend
emphasis: { label: { show:true} }
},
data: [
{ name:'北京',value:Math.round(Math.random() *1000) },
{ name:'天津',value:Math.round(Math.random() *1000) },
{ name:'上海',value:Math.round(Math.random() *1000) },
{ name:'广东',value:Math.round(Math.random() *1000) },
{ name:'台湾',value:Math.round(Math.random() *1000) },
{ name:'香港',value:Math.round(Math.random() *1000) },
{ name:'澳门',value:Math.round(Math.random() *1000) }
]
}
]
};
//以下的这段代码主要是用来处理用户的选择,应用场景是可以做地图的交互,比如点击地图上的某一个省,获取相应的省的指标变化等。
//需要特别注意的是,如果需要点击某一省作地图的操作交互的话,还需要为series属性的每一项添加一个selectedMode属性,这里的属性值为 'single'即单选,也可多选
varecConfig= require('echarts/config');
myChart.on(ecConfig.EVENT.MAP_SELECTED,function (param) {
varselected=param.selected;
varmapSeries=option.series[0];
vardata= [];
varlegendData= [];
varname;
for (varp=0,len=mapSeries.data.length; p<len; p++) {
name=mapSeries.data[p].name;
mapSeries.data[p].selected=selected[name];
if (selected[name]) {
alert(name); //这里只是简单的做一个事例说明,弹出用户所选的省,如需做其他的扩展,可以在这里边添加相应的操作
}
}
});
myChart.setOption(option);
}
);
</script> 
LineChart
<scripttype="text/javascript">
require.config({
paths: {
echarts:'./echarts/echarts',
'echarts/chart/bar':'./echarts/echarts',//这里需要注意的是除了mapchart使用的配置文件为echarts-map之外,
其他的图形引用的配置文件都为echarts,这也是一般的图形跟地图的区别
'echarts/chart/line':'./echarts/echarts'
}
});
require(
[
'echarts',
'echarts/chart/bar',
'echarts/chart/line'
],
function (ec) {
varmyChart=ecinit(documentgetElementById('main'));
option= {
tooltip: {
trigger:'axis'
},
legend: {
data: ['邮件营销','联盟广告','视频广告','直接问','搜索引擎']
},
toolbox: {
show:true,
feature: {
mark:true,
dataView: { readOnly:false },
magicType: ['line','bar'],
restore:true,
saveAsImage:true
}
},
calculable:true,
xAxis: [
{
type:'category',
boundaryGap:false,
data: ['周一','周二','周三','周四','周五','周六','周日']
}
],
yAxis: [
{
type:'value',
splitArea: { show:true }
}
],
series: [
{
name:'邮件营销',
type:'line',
stack:'总量',
data: [120,132,101,134,90,230,210]
},
{
name:'联盟广告',
type:'line',
stack:'总量',
data: [220,182,191,234,290,330,310]
},
{
name:'视频广告',
type:'line',
stack:'总量',
data: [150,232,201,154,190,330,410]
},
{
name:'直接访问',
type:'line',
stack:'总量',
data: [320,332,301,334,390,330,320]
},
{
name:'搜索引擎',
type:'line',
stack:'总量',
data: [820,932,901,934,1290,1330,1320]
}
]
};
myChart.setOption(option);
}
);
</script>
<pid="main1"style="height:500px;border:1px solid #ccc;padding:10px;"></p>
<scripttype="text/javascript">
require.config({
paths: {
echarts:'./echarts/echarts',
'echarts/chart/bar':'./echarts/echarts',
'echarts/chart/line':'./echarts/echarts'
}
});
require(
[
'echarts',
'echarts/chart/bar',
'echarts/chart/line'
],
function (ec) {
varmyChart=ecinit(documentgetElementById('main1'));
option= {
title: {
text:'未来一周气温变化',
subtext:'纯属虚构'
},
tooltip: {
trigger:'axis'
},
legend: {
data: ['最高气温'最低气温']
},
toolbox: {
show:true,
feature: {
mark:true,
dataView: { readOnly:false },
magicType: ['line','bar'],
restore:true,
saveAsImage:true
}
},
calculable:true,
xAxis: [
{
type:'category',
boundaryGap:false,
data: ['周一','周二','周三','周四','周五','周六','周日']
}
],
yAxis: [
{
type:'value',
axisLabel: {
formatter:'{value} '
},
splitArea: { show:true }
}
],
series: [
{
name:'最高气温',
type:'line',
itemStyle: {
normal: {
lineStyle: {
shadowColor:'rgba(0,0,0,4)'
}
}
},
data: [11,11,15,13,12,13,10]
},
{
name:'最低气温',
type:'line',
itemStyle: {
normal: {
lineStyle: {
shadowColor:'rgba(0,0,0,4)'
}
}
},
data: [-2,1,2,5,3,2,0]
}
]
};
myChart.setOption(option);
}
);
</script>
<pid="main2"style="height:500px;border:1px solid #ccc;padding:10px;"></p>
<scripttype="text/javascript">
require.config({
paths: {
echarts:'./echarts/echarts',
'echarts/chart/bar':'./echarts/echarts',
'echarts/chart/line':'./echarts/echarts'
}
});
require(
[
'echarts',
'echarts/chart/bar',
'echarts/chart/line'
],
function (ec) {
varmyChart=ec.init(document.getElementById('main2'));
option= {
title: {
text:'某楼盘销售情况',
subtext:'纯属虚构'
},
tooltip: {
trigger:'axis'
},
legend: {
data: ['意向','预购','成交']
},
toolbox: {
show:true,
feature: {
mark:true,
dataView: { readOnly:false },
magicType: ['line','bar'],
restore:true,
saveAsImage:true
}
},
calculable:true,
xAxis: [
{
type:'category',
boundaryGap:false,
data: ['周','周二','周三','周四','周五','周六','周日']
}
],
yAxis: [
{
type:'value'
}
],
series: [
{
name:'成交',
type:'line',
smooth:true,
itemStyle: { normal: { areaStyle: { type:'default'}} },
data: [10,12,21,54,260,830,710]
},
{
name:'预购',
type:'line',
smooth:true,
itemStyle: { normal: { areaStyle: { type:'default'}} },
data: [30,182,434,791,390,30,10]
},
{
name:'意向',
type:'line',
smooth:true,
itemStyle: { normal: { areaStyle: { type:'default'}} },
data: [1320,1132,601,234,120,90,20]
}
]
};
myChart.setOption(option);
}
);
</script>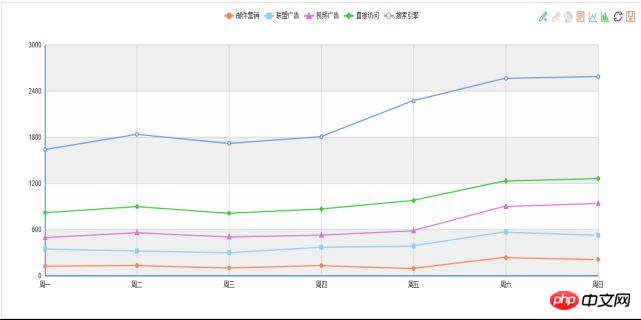
以上是echart插件等基本使用介紹的詳細內容。更多資訊請關注PHP中文網其他相關文章!

熱AI工具

Undresser.AI Undress
人工智慧驅動的應用程序,用於創建逼真的裸體照片

AI Clothes Remover
用於從照片中去除衣服的線上人工智慧工具。

Undress AI Tool
免費脫衣圖片

Clothoff.io
AI脫衣器

Video Face Swap
使用我們完全免費的人工智慧換臉工具,輕鬆在任何影片中換臉!

熱門文章
熱工具

記事本++7.3.1
好用且免費的程式碼編輯器

SublimeText3漢化版
中文版,非常好用

禪工作室 13.0.1
強大的PHP整合開發環境

Dreamweaver CS6
視覺化網頁開發工具

SublimeText3 Mac版
神級程式碼編輯軟體(SublimeText3)


 如何使用mdf和mds文件
Feb 19, 2024 pm 05:36 PM
如何使用mdf和mds文件
Feb 19, 2024 pm 05:36 PM
mdf檔案和mds檔案怎麼用隨著電腦科技的不斷進步,我們可以透過多種方式來儲存和共享資料。在數位媒體領域,我們經常會遇到一些特殊的文件格式。在這篇文章中,我們將討論一種常見的文件格式—mdf和mds文件,並介紹它們的使用方法。首先,我們需要了解mdf檔案和mds檔案的含義。 mdf是CD/DVD鏡像檔的副檔名,而mds檔則是mdf檔的元資料檔。
 crystaldiskmark是什麼軟體? -crystaldiskmark如何使用?
Mar 18, 2024 pm 02:58 PM
crystaldiskmark是什麼軟體? -crystaldiskmark如何使用?
Mar 18, 2024 pm 02:58 PM
CrystalDiskMark是一款適用於硬碟的小型HDD基準測試工具,可快速測量順序和隨機讀取/寫入速度。接下來就讓小編為大家介紹一下CrystalDiskMark,以及crystaldiskmark如何使用吧~一、CrystalDiskMark介紹CrystalDiskMark是一款廣泛使用的磁碟效能測試工具,用於評估機械硬碟和固態硬碟(SSD)的讀取和寫入速度和隨機I/O性能。它是一款免費的Windows應用程序,並提供用戶友好的介面和各種測試模式來評估硬碟效能的不同方面,並被廣泛用於硬體評
 foobar2000怎麼下載? -foobar2000怎麼使用
Mar 18, 2024 am 10:58 AM
foobar2000怎麼下載? -foobar2000怎麼使用
Mar 18, 2024 am 10:58 AM
foobar2000是一款能隨時收聽音樂資源的軟體,各種音樂無損音質帶給你,增強版本的音樂播放器,讓你得到更全更舒適的音樂體驗,它的設計理念是將電腦端的高級音頻播放器移植到手機上,提供更便捷高效的音樂播放體驗,介面設計簡潔明了易於使用它採用了極簡的設計風格,沒有過多的裝飾和繁瑣的操作能夠快速上手,同時還支持多種皮膚和主題,根據自己的喜好進行個性化設置,打造專屬的音樂播放器支援多種音訊格式的播放,它還支援音訊增益功能根據自己的聽力情況調整音量大小,避免過大的音量對聽力造成損害。接下來就讓小編為大
 BTCC教學:如何在BTCC交易所綁定使用MetaMask錢包?
Apr 26, 2024 am 09:40 AM
BTCC教學:如何在BTCC交易所綁定使用MetaMask錢包?
Apr 26, 2024 am 09:40 AM
MetaMask(中文也叫小狐狸錢包)是一款免費的、廣受好評的加密錢包軟體。目前,BTCC已支援綁定MetaMask錢包,綁定後可使用MetaMask錢包進行快速登錄,儲值、買幣等,且首次綁定還可獲得20USDT體驗金。在BTCCMetaMask錢包教學中,我們將詳細介紹如何註冊和使用MetaMask,以及如何在BTCC綁定並使用小狐狸錢包。 MetaMask錢包是什麼? MetaMask小狐狸錢包擁有超過3,000萬用戶,是當今最受歡迎的加密貨幣錢包之一。它可免費使用,可作為擴充功能安裝在網絡
 網易信箱大師怎麼用
Mar 27, 2024 pm 05:32 PM
網易信箱大師怎麼用
Mar 27, 2024 pm 05:32 PM
網易郵箱,作為中國網友廣泛使用的一種電子郵箱,一直以來以其穩定、高效的服務贏得了用戶的信賴。而網易信箱大師,則是專為手機使用者打造的信箱軟體,它大大簡化了郵件的收發流程,讓我們的郵件處理變得更加便利。那麼網易信箱大師該如何使用,具體又有哪些功能呢,下文中本站小編將為大家帶來詳細的內容介紹,希望能幫助到大家!首先,您可以在手機應用程式商店搜尋並下載網易信箱大師應用程式。在應用寶或百度手機助手中搜尋“網易郵箱大師”,然後按照提示進行安裝即可。下載安裝完成後,我們打開網易郵箱帳號並進行登錄,登入介面如下圖所示
 百度網盤app怎麼用
Mar 27, 2024 pm 06:46 PM
百度網盤app怎麼用
Mar 27, 2024 pm 06:46 PM
在如今雲端儲存已成為我們日常生活和工作中不可或缺的一部分。百度網盤作為國內領先的雲端儲存服務之一,憑藉其強大的儲存功能、高效的傳輸速度以及便捷的操作體驗,贏得了廣大用戶的青睞。而且無論你是想要備份重要文件、分享資料,還是在線上觀看影片、聽取音樂,百度網盤都能滿足你的需求。但很多用戶可能對百度網盤app的具體使用方法還不了解,那麼這篇教學就將為大家詳細介紹百度網盤app如何使用,還有疑惑的用戶們就快來跟著本文詳細了解一下吧!百度雲網盤怎麼用:一、安裝首先,下載並安裝百度雲軟體時,請選擇自訂安裝選
 如何使用迅雷下載磁力鏈接
Feb 25, 2024 pm 12:51 PM
如何使用迅雷下載磁力鏈接
Feb 25, 2024 pm 12:51 PM
隨著網路科技的快速發展,我們的生活也得到了極大的便利,其中之一就是能夠透過網路下載和分享各種資源。而在下載資源的過程中,磁力連結成為了一種非常常見且方便的下載方式。那麼,迅雷磁力連結又是如何使用的呢?下面,我將給大家詳細介紹一下。迅雷是一款非常受歡迎的下載工具,它支援多種下載方式,其中包括磁力連結。磁力連結可以理解為一種下載位址,透過它我們可以取得資源的相關
 教你使用 iOS 17.4「失竊裝置保護」新進階功能
Mar 10, 2024 pm 04:34 PM
教你使用 iOS 17.4「失竊裝置保護」新進階功能
Mar 10, 2024 pm 04:34 PM
Apple在周二推出了iOS17.4更新,為iPhone帶來了一系列新功能和修復。這次更新包含了全新的表情符號,同時歐盟用戶也能夠下載其他應用程式商店。此外,更新還加強了對iPhone安全性的控制,引入了更多的「失竊設備保護」設定選項,為用戶提供更多選擇和保障。 "iOS17.3首次引入了「失竊設備保護」功能,為用戶的敏感資料增加了額外的安全保障。當用戶不在家等熟悉地點時,該功能要求用戶首次輸入生物特徵信息,並在一小時後再次輸入資訊才能存取和更改某些數據,如修改AppleID密碼或關閉失竊設備保護功能
