H5的canvas圖表實現長條圖
這次帶給大家H5的canvas圖表實現長條圖,canvas圖表實現長條圖的注意事項有哪些,下面就是實戰案例,一起來看一下。
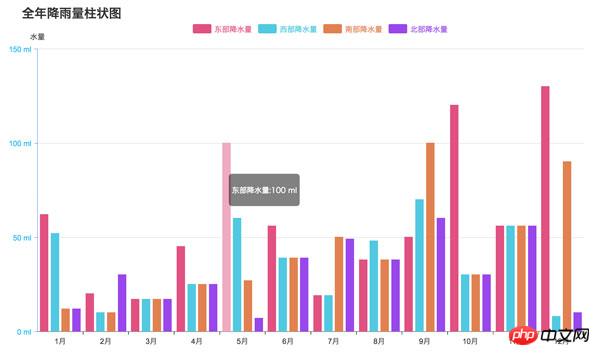
前幾天用到了圖表庫,其中百度的ECharts,感覺做得最好,看它預設用的是canvas,canvas圖表在處理大數據方面比svg要好。那我也用canvas來實現一個圖表庫吧,感覺不會太難,先實現個簡單的長條圖。
效果如下:
#主要功能點包含:
#文字的繪製
#XY軸的繪製;
資料分組繪製;
滑鼠事件的處理。
使用方式- 首先我們看一下使用方式,參考了部分ECharts的使用方式,先傳入要顯示圖表的
- html標籤
,接著呼叫init,初始化的同時傳入資料。
var con=document.getElementById('container'); var chart=new Bar(con); chart.init({ title:'全年降雨量柱状图', xAxis:{// x轴 data:['1月','2月','3月','4月','5月','6月','7月','8月','9月','10月','11月','12月'] }, yAxis:{//y轴 name:'水量', formatter:'{value} ml' }, series:[//分组数据 { name:'东部降水量', data:[62,20,17,45,100,56,19,38,50,120,56,130] }, { name:'西部降水量', data:[52,10,17,25,60,39,19,48,70,30,56,8] }, { name:'南部降水量', data:[12,10,17,25,27,39,50,38,100,30,56,90] }, { color:'hsla(270,80%,60%,1)', name:'北部降水量', data:[12,30,17,25,7,39,49,38,60,30,56,10] } ] });登入後複製圖表基類,我們後面還要寫圓餅圖,折線圖,所以把公共的部分抽出來。注意canvas.style.width與canvas.width是不一樣的,前者會拉伸圖形,後者才是我們正常用的,不會拉伸圖形。在這裡這樣寫先擴大再縮小是為了解決canvas繪製文字時模糊的問題。 -
class Chart{ constructor(container){ this.container=container; this.canvas=document.createElement('canvas'); this.ctx=this.canvas.getContext('2d'); this.W=1000*2; this.H=600*2; this.padding=120; this.paddingTop=50; this.title=''; this.legend=[]; this.series=[]; //通过缩小一倍,解决字体模糊问题 this.canvas.width=this.W; this.canvas.height=this.H; this.canvas.style.width = this.W/2 + 'px'; this.canvas.style.height = this.H/2 + 'px'; } }登入後複製長條圖初始化,呼叫es6中的Object.assign(this,opt),這個相當於JQ中的extend方法,把屬性複製到目前實例。同時也建了個tip屬性,這是個html標籤,後面顯示數據資訊用。接著繪製圖形,然後綁定滑鼠事件。
class Bar extends Chart{ constructor(container){ super(container); this.xAxis={}; this.yAxis=[]; this.animateArr=[]; } init(opt){ Object.assign(this,opt); if(!this.container)return; this.container.style.position='relative'; this.tip=document.createElement('p'); this.tip.style.cssText='display: none; position: absolute; opacity: 0.5; background: #000; color: #fff; border-radius: 5px; padding: 5px; font-size: 8px; z-index: 99;'; this.container.appendChild(this.canvas); this.container.appendChild(this.tip); this.draw(); this.bindEvent(); } draw(){//绘制 } showInfo(){//显示信息 } animate(){//执行动画 } showData(){//显示数据 }登入後複製繪製XY軸 先繪製標題,接著XY軸,然後遍歷分組資料series,裡面有複雜的計算,然後繪製XY軸的刻度,繪製分組標籤,最後是繪製數據。數據項series中是分組數據,它跟X軸的xAxis.data一一對應。每個項目可以自訂名稱和顏色,沒有指定的話,名稱賦予nunamed和自動產生顏色。這裡也用legend屬性記錄下了標籤清單訊息,因為後續滑鼠點擊判斷是否點中用的上。
canvas主要知識點:
#分組標籤使用了arcTo方法,這樣就能繪製出圓角的效果。
繪製文字使用了measureText方法,可以用來測量文字所佔寬度,這樣就可以調整下一次繪製的位置,避免位置衝突。
translate位移方法,可以放在繪製上下文(save和restore的中間)中,這樣可以避免複雜的位置運算。
draw(){
var that=this,
ctx=this.ctx,
canvas=this.canvas,
W=this.W,
H=this.H,
padding=this.padding,
paddingTop=this.paddingTop,
xl=0,xs=0,xdis=W-padding*2,//x轴单位数,每个单位长度,x轴总长度
yl=0,ys=0,ydis=H-padding*2-paddingTop;//y轴单位数,每个单位长度,y轴总长度
ctx.fillStyle='hsla(0,0%,20%,1)';
ctx.strokeStyle='hsla(0,0%,10%,1)';
ctx.lineWidth=1;
ctx.textAlign='center';
ctx.textBaseLine='middle';
ctx.font='24px arial';
ctx.clearRect(0,0,W,H);
if(this.title){
ctx.save();
ctx.textAlign='left';
ctx.font='bold 40px arial';
ctx.fillText(this.title,padding-50,70);
ctx.restore();
}
if(this.yAxis&&this.yAxis.name){
ctx.fillText(this.yAxis.name,padding,padding+paddingTop-30);
}
// x轴
ctx.save();
ctx.beginPath();
ctx.translate(padding,H-padding);
ctx.moveTo(0,0);
ctx.lineTo(W-2*padding,0);
ctx.stroke();
// x轴刻度
if(this.xAxis&&(xl=this.xAxis.data.length)){
xs=(W-2*padding)/xl;
this.xAxis.data.forEach((obj,i)=>{
var x=xs*(i+1);
ctx.moveTo(x,0);
ctx.lineTo(x,10);
ctx.stroke();
ctx.fillText(obj,x-xs/2,40);
});
}
ctx.restore();
// y轴
ctx.save();
ctx.beginPath();
ctx.strokeStyle='hsl(220,100%,50%)';
ctx.translate(padding,H-padding);
ctx.moveTo(0,0);
ctx.lineTo(0,2*padding+paddingTop-H);
ctx.stroke();
ctx.restore();
if(this.series.length){
var curr,txt,dim,info,item,tw=0;
for(var i=0;i<this.series.length;i++){
item=this.series[i];
if(!item.data||!item.data.length){
this.series.splice(i--,1);continue;
}
// 赋予没有颜色的项
if(!item.color){
var hsl=i%2?180+20*i/2:20*(i-1);
item.color='hsla('+hsl+',70%,60%,1)';
}
item.name=item.name||'unnamed';
// 画分组标签
ctx.save();
ctx.translate(padding+W/4,paddingTop+40);
that.legend.push({
hide:item.hide||false,
name:item.name,
color:item.color,
x:padding+that.W/4+i*90+tw,
y:paddingTop+40,
w:60,
h:30,
r:5
});
ctx.textAlign='left';
ctx.fillStyle=item.color;
ctx.strokeStyle=item.color;
roundRect(ctx,i*90+tw,0,60,30,5);
ctx.globalAlpha=item.hide?0.3:1;
ctx.fill();
ctx.fillText(item.name,i*90+tw+70,26);
tw+=ctx.measureText(item.name).width;//计算字符长度
ctx.restore();
if(item.hide)continue;
//计算数据在Y轴刻度
if(!info){
info=calculateY(item.data.slice(0,xl));
}
curr=calculateY(item.data.slice(0,xl));
if(curr.max>info.max){
info=curr;
}
}
if(!info) return;
yl=info.num;
ys=ydis/yl;
//画Y轴刻度
ctx.save();
ctx.fillStyle='hsl(200,100%,60%)';
ctx.translate(padding,H-padding);
for(var i=0;i<=yl;i++){
ctx.beginPath();
ctx.strokeStyle='hsl(220,100%,50%)';
ctx.moveTo(-10,-Math.floor(ys*i));
ctx.lineTo(0,-Math.floor(ys*i));
ctx.stroke();
ctx.beginPath();
ctx.strokeStyle='hsla(0,0%,80%,1)';
ctx.moveTo(0,-Math.floor(ys*i));
ctx.lineTo(xdis,-Math.floor(ys*i));
ctx.stroke();
ctx.textAlign='right';
dim=Math.min(Math.floor(info.step*i),info.max);
txt=this.yAxis.formatter?this.yAxis.formatter.replace('{value}',dim):dim;
ctx.fillText(txt,-20,-ys*i+10);
}
ctx.restore();
//画数据
this.showData(xl,xs,info.max);
}
}
因為資料項目需要後續執行動畫和滑鼠滑過的時候顯示內容,所以把它放進動畫隊列animateArr中。這裡要把分組資料展開,把之前的兩次嵌套的陣列轉為一層,併計算好每個資料項的屬性,例如名稱,x座標,y座標,寬度,速度,顏色。資料組織完畢後,接著執行動畫。
showData(xl,xs,max){
    //画数据
    var that=this,
        ctx=this.ctx,
        ydis=this.H-this.padding*2-this.paddingTop,
        sl=this.series.filter(s=>!s.hide).length,
        sp=Math.max(Math.pow(10-sl,2)/3-4,5),
        w=(xs-sp*(sl+1))/sl,
        h,x,index=0;
    that.animateArr.length=0;
    // 展开数据项,填入动画队列
    for(var i=0,item,len=this.series.length;i<len;i++){
        item=this.series[i];
        if(item.hide)continue;
        item.data.slice(0,xl).forEach((d,j)=>{
            h=d/max*ydis;
            x=xs*j+w*index+sp*(index+1);
            that.animateArr.push({
                index:i,
                name:item.name,
                num:d,
                x:Math.round(x),
                y:1,
                w:Math.round(w),
                h:Math.floor(h+2),
                vy:Math.max(300,Math.floor(h*2))/100,
                color:item.color
            });
        });
        index++;
    }
    this.animate();
}animate(){
var that=this,
ctx=this.ctx,
isStop=true;
(function run(){
isStop=true;
for(var i=0,item;i<that.animateArr.length;i++){
item=that.animateArr[i];
if(item.y-item.h>=0.1){
item.y=item.h;
} else {
item.y+=item.vy;
}
if(item.y<item.h){
ctx.save();
// ctx.translate(that.padding+item.x,that.H-that.padding);
ctx.fillStyle=item.color;
ctx.fillRect(that.padding+item.x,that.H-that.padding-item.y,item.w,item.y);
ctx.restore();
isStop=false;
}
}
if(isStop)return;
requestAnimationFrame(run);
}())
}bindEvent(){
var that=this,
canvas=this.canvas,
ctx=this.ctx;
this.canvas.addEventListener('mousemove',function(e){
var isLegend=false;
// pos=WindowToCanvas(canvas,e.clientX,e.clientY);
var box=canvas.getBoundingClientRect();
var pos = {
x:e.clientX-box.left,
y:e.clientY-box.top
};
// 分组标签
for(var i=0,item,len=that.legend.length;i<len;i++){
item=that.legend[i];
ctx.save();
roundRect(ctx,item.x,item.y,item.w,item.h,item.r);
// 因为缩小了一倍,所以坐标要*2
if(ctx.isPointInPath(pos.x*2,pos.y*2)){
canvas.style.cursor='pointer';
ctx.restore();
isLegend=true;
break;
}
canvas.style.cursor='default';
ctx.restore();
}
if(isLegend) return;
//选择数据项
for(var i=0,item,len=that.animateArr.length;i<len;i++){
item=that.animateArr[i];
ctx.save();
ctx.fillStyle=item.color;
ctx.beginPath();
ctx.rect(that.padding+item.x,that.H-that.padding-item.h,item.w,item.h);
if(ctx.isPointInPath(pos.x*2,pos.y*2)){
//清空后再重新绘制透明度为0.5的图形
ctx.clearRect(that.padding+item.x,that.H-that.padding-item.h,item.w,item.h);
ctx.globalAlpha=0.5;
ctx.fill();
canvas.style.cursor='pointer';
that.showInfo(pos,item);
ctx.restore();
break;
}
canvas.style.cursor='default';
that.tip.style.display='none';
ctx.globalAlpha=1;
ctx.fill();
ctx.restore();
}
},false);
this.canvas.addEventListener('mousedown',function(e){
e.preventDefault();
var box=canvas.getBoundingClientRect();
var pos = {
x:e.clientX-box.left,
y:e.clientY-box.top
};
for(var i=0,item,len=that.legend.length;i<len;i++){
item=that.legend[i];
roundRect(ctx,item.x,item.y,item.w,item.h,item.r);
// 因为缩小了一倍,所以坐标要*2
if(ctx.isPointInPath(pos.x*2,pos.y*2)){
that.series[i].hide=!that.series[i].hide;
that.animateArr.length=0;
that.draw();
break;
}
}
},false);
}
//显示数据
showInfo(pos,obj){
var txt=this.yAxis.formatter?this.yAxis.formatter.replace('{value}',obj.num):obj.num;
var box=this.canvas.getBoundingClientRect();
var con=this.container.getBoundingClientRect();
this.tip.innerHTML = '<p>'+obj.name+':'+txt+'</p>';
this.tip.style.left=(pos.x+(box.left-con.left)+10)+'px';
this.tip.style.top=(pos.y+(box.top-con.top)+10)+'px';
this.tip.style.display='block';
}相信看了本文案例你已经掌握了方法,更多精彩请关注php中文网其它相关文章!
推荐阅读:
以上是H5的canvas圖表實現長條圖的詳細內容。更多資訊請關注PHP中文網其他相關文章!

熱AI工具

Undresser.AI Undress
人工智慧驅動的應用程序,用於創建逼真的裸體照片

AI Clothes Remover
用於從照片中去除衣服的線上人工智慧工具。

Undress AI Tool
免費脫衣圖片

Clothoff.io
AI脫衣器

AI Hentai Generator
免費產生 AI 無盡。

熱門文章
熱工具

記事本++7.3.1
好用且免費的程式碼編輯器

SublimeText3漢化版
中文版,非常好用

禪工作室 13.0.1
強大的PHP整合開發環境

Dreamweaver CS6
視覺化網頁開發工具

SublimeText3 Mac版
神級程式碼編輯軟體(SublimeText3)