

淺談使用angular9+echarts繪製3D地圖

這篇文章跟大家分享angular中echarts的用法,介紹繪製3D地圖的方法。有一定的參考價值,有需要的朋友可以參考一下,希望對大家有幫助。

新建一個angular9的工程
#1、安裝了@angular-cli的鷹架
2、 <strong>ng -v</strong>查看版本
3、ng new my-project(專案名稱)
下載echarts
npm i echarts
相關推薦:《angular教學》
##建立容器
src/app/app. componnet.html<div id="main" style="width:800px;height:500px"></div>
建立地圖實例
src/app/app.componnet.tsimport { Component } from '@angular/core';
import * as echarts from "echarts";
import 'echarts/map/js/china.js'
@Component({
selector: 'app-root',
templateUrl: './app.component.html',
styleUrls: ['./app.component.scss']
})
export class AppComponent {
option = {
title: {
top: 10,
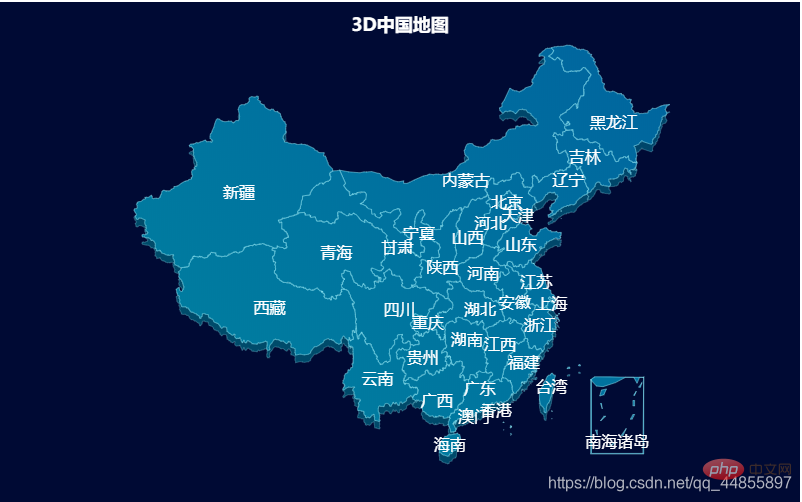
text: '3D中国地图',
left: 'center',
textStyle: {
color: '#fff'
}
},
backgroundColor: 'rgba(0, 10, 52, 1)',
geo: {
map: 'china',
aspectScale: 0.75,
layoutCenter: ["50%", "51.5%"], //地图位置
layoutSize: '118%',
roam: true,
itemStyle: {
normal: {
borderColor: 'rgba(147, 235, 248, 1)',
borderWidth: 0.5,
color: {
type: 'linear-gradient',
x: 0,
y: 1500,
x2: 2500,
y2: 0,
colorStops: [{
offset: 0,
color: '#009DA1' // 0% 处的颜色
}, {
offset: 1,
color: '#005B9E' // 50% 处的颜色
}],
global: true // 缺省为 false
},
opacity: 0.5,
},
emphasis: {
areaColor: '#2a333d'
}
},
regions: [{
name: '南海诸岛',
itemStyle: {
areaColor: 'rgba(0, 10, 52, 1)',
borderColor: 'rgba(0, 10, 52, 1)'
},
emphasis: {
areaColor: 'rgba(0, 10, 52, 1)',
borderColor: 'rgba(0, 10, 52, 1)'
}
}],
z: 2
},
series: [{
type: 'map',
map: 'china',
tooltip: {
show: false
},
label: {
show: true,
color: '#FFFFFF',
fontSize: 16
},
aspectScale: 0.75,
layoutCenter: ["50%", "50%"], //地图位置
layoutSize: '118%',
roam: true,
itemStyle: {
normal: {
borderColor: 'rgba(147, 235, 248, 0.6)',
borderWidth: 0.8,
areaColor: {
type: 'linear-gradient',
x: 0,
y: 1200,
x2: 1000,
y2: 0,
colorStops: [{
offset: 0,
color: '#009DA1' // 0% 处的颜色
}, {
offset: 1,
color: '#005B9E' // 50% 处的颜色
}],
global: true // 缺省为 false
},
},
emphasis: {
areaColor: 'rgba(147, 235, 248, 0)'
}
},
zlevel: 1
}]
};
ngOnInit(){
let dom = document.getElementById('main')
let myChart = echarts.init(dom)
myChart.on('georoam', function(params) {
var option = myChart.getOption(); //获得option对象
if (params.zoom != null && params.zoom != undefined) { //捕捉到缩放时
option.geo[0].zoom = option.series[0].zoom; //下层geo的缩放等级跟着上层的geo一起改变
option.geo[0].center = option.series[0].center; //下层的geo的中心位置随着上层geo一起改变
} else { //捕捉到拖曳时
option.geo[0].center = option.series[0].center; //下层的geo的中心位置随着上层geo一起改变
}
myChart.setOption(option); //设置option
});
myChart.setOption(this.option)
}
}效果圖片
程式設計影片! !
以上是淺談使用angular9+echarts繪製3D地圖的詳細內容。更多資訊請關注PHP中文網其他相關文章!

熱AI工具

Undresser.AI Undress
人工智慧驅動的應用程序,用於創建逼真的裸體照片

AI Clothes Remover
用於從照片中去除衣服的線上人工智慧工具。

Undress AI Tool
免費脫衣圖片

Clothoff.io
AI脫衣器

AI Hentai Generator
免費產生 AI 無盡。

熱門文章
熱工具

記事本++7.3.1
好用且免費的程式碼編輯器

SublimeText3漢化版
中文版,非常好用

禪工作室 13.0.1
強大的PHP整合開發環境

Dreamweaver CS6
視覺化網頁開發工具

SublimeText3 Mac版
神級程式碼編輯軟體(SublimeText3)
熱門話題


 如何在瀏覽器中優化JavaScript代碼以進行性能?
Mar 18, 2025 pm 03:14 PM
如何在瀏覽器中優化JavaScript代碼以進行性能?
Mar 18, 2025 pm 03:14 PM
本文討論了在瀏覽器中優化JavaScript性能的策略,重點是減少執行時間並最大程度地減少對頁面負載速度的影響。

 如何使用瀏覽器開發人員工具有效調試JavaScript代碼?
Mar 18, 2025 pm 03:16 PM
如何使用瀏覽器開發人員工具有效調試JavaScript代碼?
Mar 18, 2025 pm 03:16 PM
本文討論了使用瀏覽器開發人員工具的有效JavaScript調試,專注於設置斷點,使用控制台和分析性能。
 誰得到更多的Python或JavaScript?
Apr 04, 2025 am 12:09 AM
誰得到更多的Python或JavaScript?
Apr 04, 2025 am 12:09 AM
Python和JavaScript開發者的薪資沒有絕對的高低,具體取決於技能和行業需求。 1.Python在數據科學和機器學習領域可能薪資更高。 2.JavaScript在前端和全棧開發中需求大,薪資也可觀。 3.影響因素包括經驗、地理位置、公司規模和特定技能。
 如何使用源地圖調試縮小JavaScript代碼?
Mar 18, 2025 pm 03:17 PM
如何使用源地圖調試縮小JavaScript代碼?
Mar 18, 2025 pm 03:17 PM
本文說明瞭如何使用源地圖通過將其映射回原始代碼來調試JAVASCRIPT。它討論了啟用源地圖,設置斷點以及使用Chrome DevTools和WebPack之類的工具。
 如何使用JavaScript將具有相同ID的數組元素合併到一個對像中?
Apr 04, 2025 pm 05:09 PM
如何使用JavaScript將具有相同ID的數組元素合併到一個對像中?
Apr 04, 2025 pm 05:09 PM
如何在JavaScript中將具有相同ID的數組元素合併到一個對像中?在處理數據時,我們常常會遇到需要將具有相同ID�...
 console.log輸出結果差異:兩次調用為何不同?
Apr 04, 2025 pm 05:12 PM
console.log輸出結果差異:兩次調用為何不同?
Apr 04, 2025 pm 05:12 PM
深入探討console.log輸出差異的根源本文將分析一段代碼中console.log函數輸出結果的差異,並解釋其背後的原因。 �...
