UNiAPP怎麼繪製高德地圖?以下這篇文章帶大家了解render.js的用法,介紹一下如何在uniAPP中使用render.js 繪製高德地圖,希望對大家有幫助。

#renderjs是一個運行在視圖層的js。它比WXS更強大。它只支援app-vue和h5。 renderjs的主要功能有2個:
使用方式
設定script 節點的lang 為renderjs
<view id="test"></view>
<script module="test">
    export default {
        mounted() {
            // ...
        },
        methods: {
        // ...
        }
    }
</script>明確需求
1. 在uni中的vue文件下使用地图
2. 需要在地图根据经纬度标记点,并且可点击
3. 需要在标记点与点之间连线
4. 地图上需要悬浮两个按钮
#解決想法
##uni自帶的有map元件,功能還是比較強大,但是在vue檔案下很多功能受限,必須在nvue檔案中才能發揮出功能。在本次編寫中因為其他原因無法使用nvue文件,所以不得不想其他方法,以及在地圖上懸浮按鈕,解決層級問題也是一個難點,所以放棄了uni的map組件。
最後多次嘗試後,選擇了使用render.js 來呼叫高德地圖,能夠完美解決上述需求和問題,特此記錄與分享。
編寫程式碼
vue頁面使用render.js
render.js 主要是透過script標籤引入,如下圖: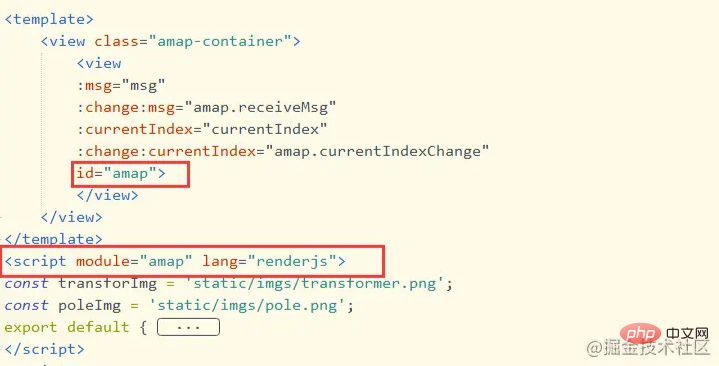
初始化地圖
data(){
map:null,
myData:[],
},
//以下是写在methods中
//引入高德地图SDK
init(){
if (typeof window.AMap === 'function') {
this.initAmap()
} else {
// 动态引入较大类库避免影响页面展示
const script = document.createElement('script')
script.src = 'https://webapi.amap.com/maps?v=1.4.15&key=' + '你的key'
script.onload = this.initAmap.bind(this)
document.head.appendChild(script)
console.log('eles');
}
},
//初始化地图
initAmap() {
this.map = new AMap.Map('amap', {
resizeEnable: true,
center: [this.myData[0].longitude,this.myData[0].latitude],
zooms: [4, 20], //设置地图级别范围
zoom: 18
})
this.map.on('complete',()=>{
console.log('加载完成');
})
this.getItem(this.myData)
},
// 给地图绘制点 Makers
addMaker(item){
let marker = new AMap.Marker({
//经纬度位置
position: new AMap.LngLat(item.longitude, item.latitude),
//便宜量
offset: new AMap.Pixel(-10, -24),
//图标
icon: new AMap.Icon({
//大小
size: new AMap.Size(20, 25),
imageSize: new AMap.Size(20, 25),
image:'imgpath'
}),
//图标展示层级,防止被隐藏时编写
zIndex:100,
//图标旁边展示内容
label:{
content:`<view>content</view>`,
offset: new AMap.Pixel(10, -18)
}
})
//给图标添加点击事件
marker.on('click', (e) => {
console.log(item,e);
})
//将图标添加到地图中
this.map.add(marker)
},
//绘制点与点之间的线段 Polyline类
initLine(start,end){
let polyline = new AMap.Polyline({
//线段粗细
strokeWeight:5,
//颜色
strokeColor:'#007AFF',
//形状
lineCap:'round',
lineJoin:'round',
//是否显示方向
showDir:true,
//起点与终点经纬度[[longitudeStart,latitudeStart],[longitudeEnd,latitudeEnd]]
path:[start,end]
})
//向地铁图添加线段
this.map.add(polyline)
},實現效果
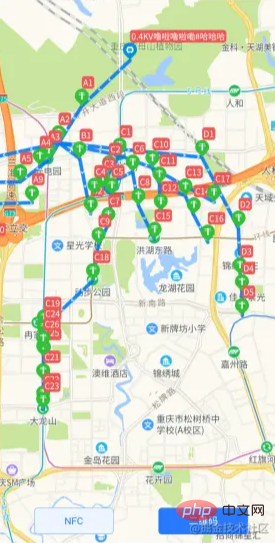
#關於高德地圖的具體使用請參考高德API##render.js中的通訊
1、資料的綁定
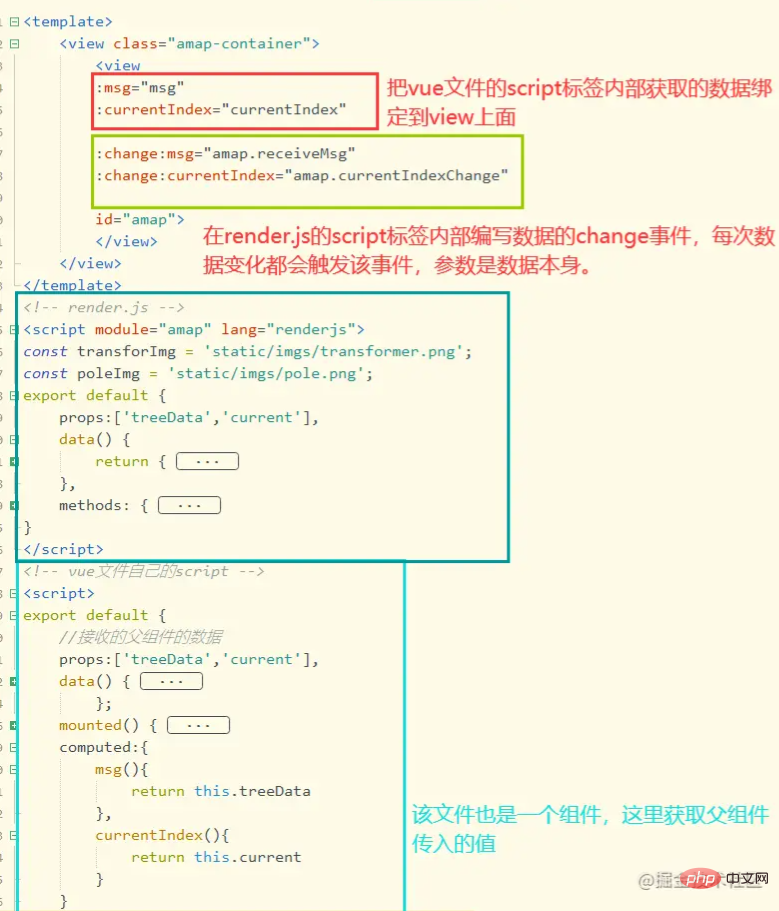
#2、資料的接收
3、render.js中向vue頁面發送資料##原理跟上面差不多 在render.js中,拋出一個方法,然後在頁面中編寫該方法監聽,具體如下
    //render.js
    //向vue页面抛出数据
    sendMsg(){
        this.$ownerInstance.callMethod('reciveMsg', '我是render.js的数据')
    }
    //针对页面点击或直接调用
    sendMsg2(e,ownerInstance){
        ownerInstance.callMethod('reciveMsg', '我是render.js的数据')
} //vue页面接收数据
reciveMsg(data){
console.log(data) //我是render.js的数据
}總結
最後附上UNI官方連結和高德API連結
https://uniapp.dcloud.io/frame?id=renderjshttps://lbs.amap.com /api/javascript-api/guide/abc/load》uniapp教學
推薦:《
以上是什麼是render.js? UNiAPP中怎麼使用它來繪製高德地圖?的詳細內容。更多資訊請關注PHP中文網其他相關文章!
