用 Python 繪製幾張有趣的視覺化圖表

python
可視化圖表

流程圖存在於我們生活的方方面面,對於我們追蹤專案的進展,做出各種事情的決策都有著巨大的幫助,而對於萬能的Python而言呢,繪製流程圖也是十分輕鬆的,今天小編就來為大家介紹兩個用來繪製流程圖的模組,我們先來看第一個。
SchemDraw
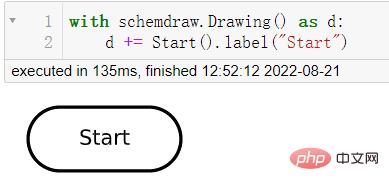
那麼在SchemDraw模組當中呢,有六個元素用來代表流程圖的主要節點的,橢圓形代表的是決策的開始和結束,程式碼如下:
import schemdraw
from schemdraw.flow import *
with schemdraw.Drawing() as d:
 d += Start().label("Start")
登入後複製
output
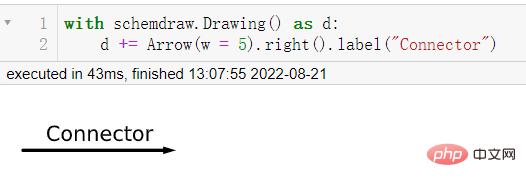
#箭頭表示的是決策的走向,用來連接各個節點的,程式碼如下:
with schemdraw.Drawing() as d:
 d += Arrow(w = 5).right().label("Connector")
登入後複製
output
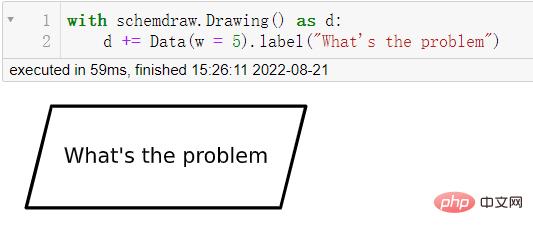
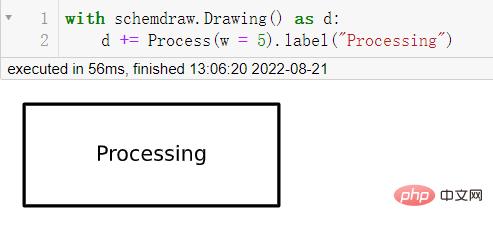
平行四邊形代表的是你所要去處理和解決的問題,而長方形所代表的是你所要為此做出的努力或說是過程,程式碼如下:
with schemdraw.Drawing() as d:
 d += Data(w = 5).label("What's the problem")
登入後複製
output
with schemdraw.Drawing() as d:
 d += Process(w = 5).label("Processing")
登入後複製
output
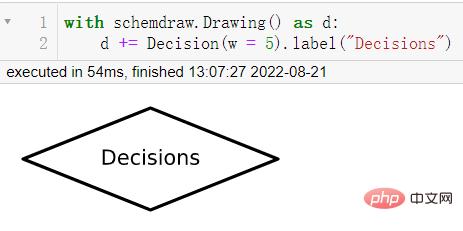
#而菱形代表的則是決策的具體情況,程式碼如下:
with schemdraw.Drawing() as d:
 d += Decision(w = 5).label("Decisions")
登入後複製
output
import schemdraw
from schemdraw.flow import *
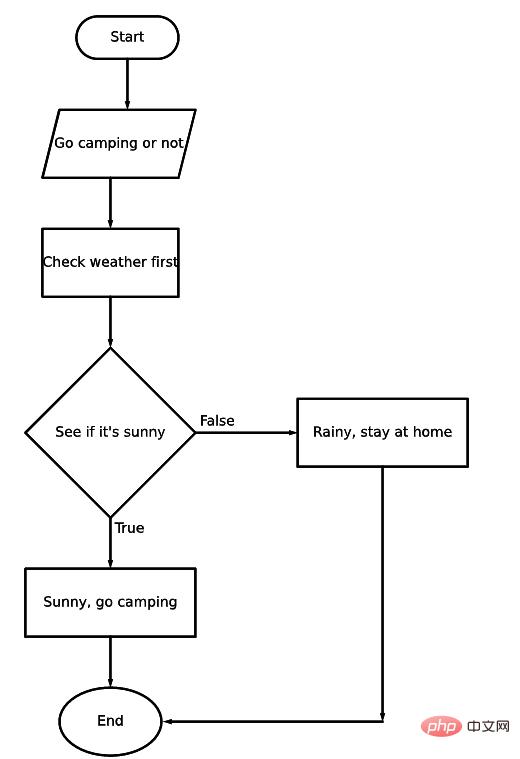
with schemdraw.Drawing() as d:
d+= Start().label("Start")
d+= Arrow().down(d.unit/2)
# 具体是啥问题嘞
d+= Data(w = 4).label("Go camping or not")
d+= Arrow().down(d.unit/2)
# 第一步 查看天气
d+= Box(w = 4).label("Check weather first")
d+= Arrow().down(d.unit/2)
# 是否是晴天
d+= (decision := Decision(w = 5, h= 5,
S = "True",
E = "False").label("See if it's sunny"))
# 如果是真的话
d+= Arrow().length(d.unit/2)
d+= (true := Box(w = 5).label("Sunny, go camping"))
d+= Arrow().length(d.unit/2)
# 结束
d+= (end := Ellipse().label("End"))
# 如果不是晴天的话
d+= Arrow().right(d.unit).at(decision.E)
# 那如果是下雨天的话,就不能去露营咯
d+= (false := Box(w = 5).label("Rainy, stay at home"))
# 决策的走向
d+= Arrow().down(d.unit*2.5).at(false.S)
# 决策的走向
d+= Arrow().left(d.unit*2.15)
d.save("palindrome flowchart.jpeg", dpi = 300)登入後複製
import networkx as nx
import matplotlib.pyplot as plt
import numpy as np
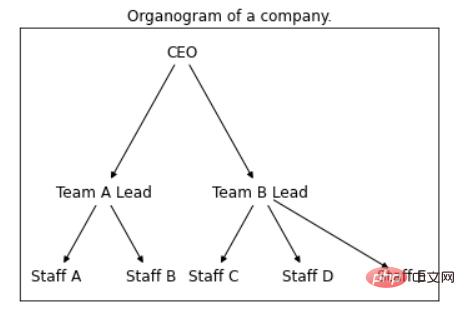
G = nx.DiGraph()
nodes = np.arange(0, 8).tolist()
G.add_nodes_from(nodes)
# 节点连接的信息,哪些节点的是相连接的
G.add_edges_from([(0,1), (0,2),
(1,3), (1, 4),
(2, 5), (2, 6), (2,7)])
# 节点的位置
pos = {0:(10, 10),
1:(7.5, 7.5), 2:(12.5, 7.5),
3:(6, 6), 4:(9, 6),
5:(11, 6), 6:(14, 6), 7:(17, 6)}
# 节点的标记
labels = {0:"CEO",
1: "Team A Lead",
2: "Team B Lead",
3: "Staff A",
4: "Staff B",
5: "Staff C",
6: "Staff D",
7: "Staff E"}
nx.draw_networkx(G, pos = pos, labels = labels, arrows = True,
node_shape = "s", node_color = "white")
plt.title("Company Structure")
plt.show()登入後複製
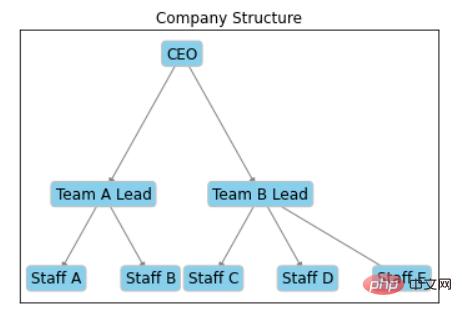
nx.draw_networkx(G, pos = pos, labels = labels,
bbox = dict(facecolor = "skyblue",
boxstyle = "round", ec = "silver", pad = 0.3),
edge_color = "gray"
 )
plt.title("Company Structure")
plt.show()
登入後複製
以上是用 Python 繪製幾張有趣的視覺化圖表的詳細內容。更多資訊請關注PHP中文網其他相關文章!
本網站聲明
本文內容由網友自願投稿,版權歸原作者所有。本站不承擔相應的法律責任。如發現涉嫌抄襲或侵權的內容,請聯絡admin@php.cn

熱AI工具

Undresser.AI Undress
人工智慧驅動的應用程序,用於創建逼真的裸體照片

AI Clothes Remover
用於從照片中去除衣服的線上人工智慧工具。

Undress AI Tool
免費脫衣圖片

Clothoff.io
AI脫衣器

AI Hentai Generator
免費產生 AI 無盡。

熱門文章
R.E.P.O.能量晶體解釋及其做什麼(黃色晶體)
2 週前
By 尊渡假赌尊渡假赌尊渡假赌
倉庫:如何復興隊友
4 週前
By 尊渡假赌尊渡假赌尊渡假赌
Hello Kitty Island冒險:如何獲得巨型種子
3 週前
By 尊渡假赌尊渡假赌尊渡假赌
擊敗分裂小說需要多長時間?
3 週前
By DDD
R.E.P.O.保存文件位置:在哪里以及如何保護它?
3 週前
By DDD
熱工具

記事本++7.3.1
好用且免費的程式碼編輯器

SublimeText3漢化版
中文版,非常好用

禪工作室 13.0.1
強大的PHP整合開發環境

Dreamweaver CS6
視覺化網頁開發工具

SublimeText3 Mac版
神級程式碼編輯軟體(SublimeText3)


 Google AI 為開發者發佈 Gemini 1.5 Pro 和 Gemma 2
Jul 01, 2024 am 07:22 AM
Google AI 為開發者發佈 Gemini 1.5 Pro 和 Gemma 2
Jul 01, 2024 am 07:22 AM
Google AI 為開發者發佈 Gemini 1.5 Pro 和 Gemma 2