
聚類或聚類分析是無監督學習問題。它通常被用作數據分析技術,用於發現數據中的有趣模式,例如基於其行為的客戶群。有許多聚類演算法可供選擇,對於所有情況,沒有單一的最佳聚類演算法。相反,最好探索一系列聚類演算法以及每種演算法的不同配置。在本教程中,你將發現如何在 python 中安裝和使用頂級聚類演算法。
完成本教學後,你將知道:
教學概述
聚類分析,即聚類,是無監督的機器學習任務。它包括自動發現資料中的自然分組。與監督學習(類似預測建模)不同,聚類演算法只解釋輸入數據,並在特徵空間中找到自然組或群集。
群集通常是特徵空間中的密度區域,其中來自域的範例(觀測或資料行)比其他群集更接近群集。群集可以具有作為樣本或點特徵空間的中心(質心),並且可以具有邊界或範圍。
聚類可以作為資料分析活動提供幫助,以便了解更多關於問題領域的信息,即所謂的模式發現或知識發現。例如:
聚類也可用作特徵工程的類型,其中現有的和新的範例可被映射並標記為屬於資料中所識別的群集之一。雖然確實存在許多特定於群集的定量措施,但是對所識別的群集的評估是主觀的,並且可能需要領域專家。通常,聚類演算法在人工合成資料集上與預先定義的群集進行學術比較,預計演算法會發現這些群集。
有許多類型的聚類演算法。許多演算法在特徵空間中的範例之間使用相似度或距離度量,以發現密集的觀測區域。因此,在使用聚類演算法之前,擴展資料通常是良好的實踐。
一些聚類演算法要求您指定或猜測資料中要發現的群集的數量,而另一些演算法要求指定觀測之間的最小距離,其中範例可以被視為“關閉”或“連接”。因此,聚類分析是一個迭代過程,在該過程中,對所識別的群集的主觀評估被反饋回演算法配置的改變中,直到達到期望的或適當的結果。 scikit-learn 函式庫提供了一套不同的聚類演算法供選擇。下面列出了10種比較流行的演算法:
sudo pip install scikit-learn
# 检查 scikit-learn 版本
import sklearn
print(sklearn.__version__)
0.22.1
# 综合分类数据集
from numpy import where
from sklearn.datasets import make_classification
from matplotlib import pyplot
# 定义数据集
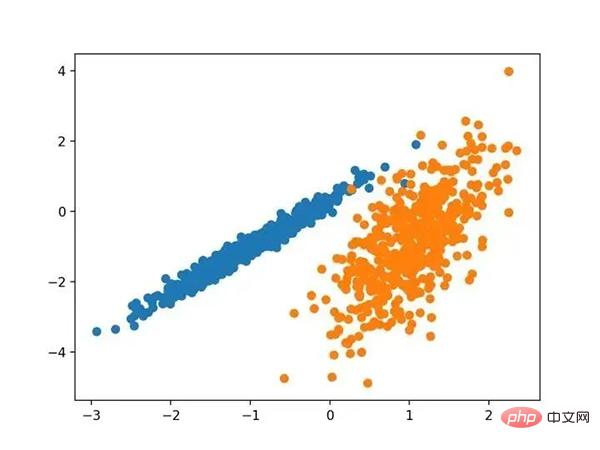
X, y = make_classification(n_samples=1000, n_features=2, n_informative=2, n_redundant=0, n_clusters_per_class=1, random_state=4)
# 为每个类的样本创建散点图
for class_value in range(2):
# 获取此类的示例的行索引
row_ix = where(y == class_value)
# 创建这些样本的散布
pyplot.scatter(X[row_ix, 0], X[row_ix, 1])
# 绘制散点图
pyplot.show()
# 亲和力传播聚类
from numpy import unique
from numpy import where
from sklearn.datasets import make_classification
from sklearn.cluster import AffinityPropagation
from matplotlib import pyplot
# 定义数据集
X, _ = make_classification(n_samples=1000, n_features=2, n_informative=2, n_redundant=0, n_clusters_per_class=1, random_state=4)
# 定义模型
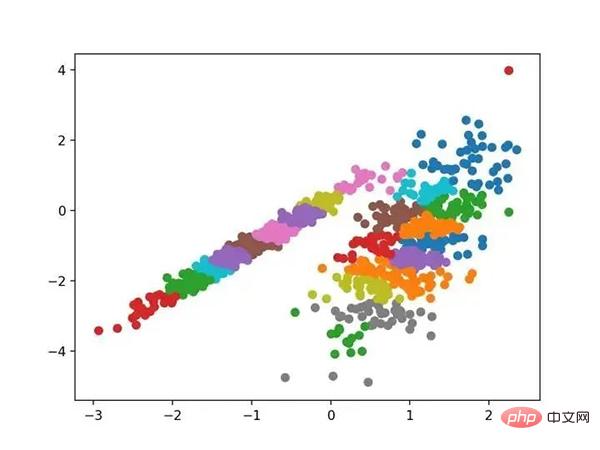
model = AffinityPropagation(damping=0.9)
# 匹配模型
model.fit(X)
# 为每个示例分配一个集群
yhat = model.predict(X)
# 检索唯一群集
clusters = unique(yhat)
# 为每个群集的样本创建散点图
for cluster in clusters:
# 获取此群集的示例的行索引
row_ix = where(yhat == cluster)
# 创建这些样本的散布
pyplot.scatter(X[row_ix, 0], X[row_ix, 1])
# 绘制散点图
pyplot.show()
# 聚合聚类
from numpy import unique
from numpy import where
from sklearn.datasets import make_classification
from sklearn.cluster import AgglomerativeClustering
from matplotlib import pyplot
# 定义数据集
X, _ = make_classification(n_samples=1000, n_features=2, n_informative=2, n_redundant=0, n_clusters_per_class=1, random_state=4)
# 定义模型
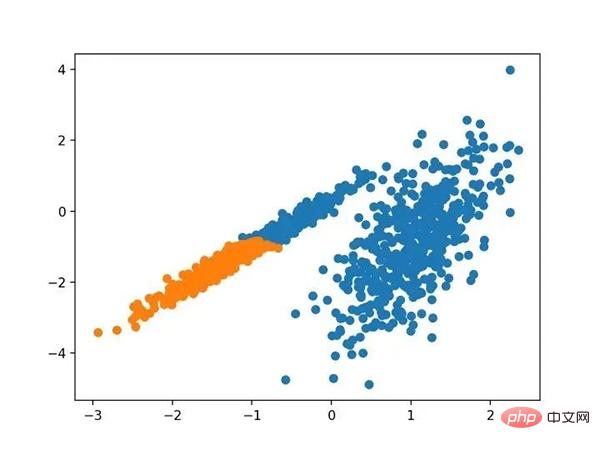
model = AgglomerativeClustering(n_clusters=2)
# 模型拟合与聚类预测
yhat = model.fit_predict(X)
# 检索唯一群集
clusters = unique(yhat)
# 为每个群集的样本创建散点图
for cluster in clusters:
# 获取此群集的示例的行索引
row_ix = where(yhat == cluster)
# 创建这些样本的散布
pyplot.scatter(X[row_ix, 0], X[row_ix, 1])
# 绘制散点图
pyplot.show()
BIRCH 聚类( BIRCH 是平衡迭代减少的缩写,聚类使用层次结构)包括构造一个树状结构,从中提取聚类质心。
它是通过 Birch 类实现的,主要配置是“ threshold ”和“ n _ clusters ”超参数,后者提供了群集数量的估计。下面列出了完整的示例。
# birch聚类
from numpy import unique
from numpy import where
from sklearn.datasets import make_classification
from sklearn.cluster import Birch
from matplotlib import pyplot
# 定义数据集
X, _ = make_classification(n_samples=1000, n_features=2, n_informative=2, n_redundant=0, n_clusters_per_class=1, random_state=4)
# 定义模型
model = Birch(threshold=0.01, n_clusters=2)
# 适配模型
model.fit(X)
# 为每个示例分配一个集群
yhat = model.predict(X)
# 检索唯一群集
clusters = unique(yhat)
# 为每个群集的样本创建散点图
for cluster in clusters:
# 获取此群集的示例的行索引
row_ix = where(yhat == cluster)
# 创建这些样本的散布
pyplot.scatter(X[row_ix, 0], X[row_ix, 1])
# 绘制散点图
pyplot.show()
运行该示例符合训练数据集上的模型,并预测数据集中每个示例的群集。然后创建一个散点图,并由其指定的群集着色。在这种情况下,可以找到一个很好的分组。
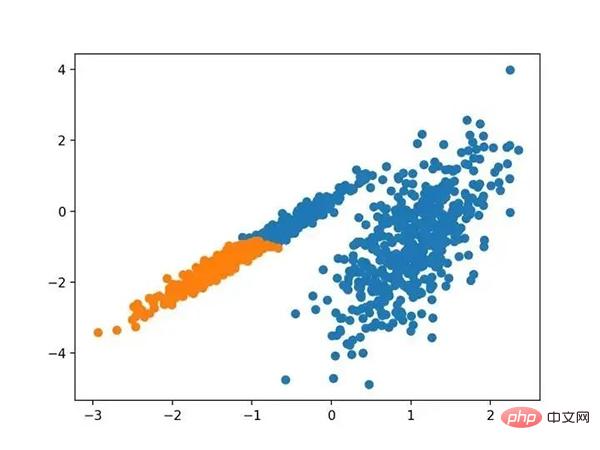
使用BIRCH聚类确定具有聚类的数据集的散点图
DBSCAN 聚类(其中 DBSCAN 是基于密度的空间聚类的噪声应用程序)涉及在域中寻找高密度区域,并将其周围的特征空间区域扩展为群集。
它是通过 DBSCAN 类实现的,主要配置是“ eps ”和“ min _ samples ”超参数。
下面列出了完整的示例。
# dbscan 聚类
from numpy import unique
from numpy import where
from sklearn.datasets import make_classification
from sklearn.cluster import DBSCAN
from matplotlib import pyplot
# 定义数据集
X, _ = make_classification(n_samples=1000, n_features=2, n_informative=2, n_redundant=0, n_clusters_per_class=1, random_state=4)
# 定义模型
model = DBSCAN(eps=0.30, min_samples=9)
# 模型拟合与聚类预测
yhat = model.fit_predict(X)
# 检索唯一群集
clusters = unique(yhat)
# 为每个群集的样本创建散点图
for cluster in clusters:
# 获取此群集的示例的行索引
row_ix = where(yhat == cluster)
# 创建这些样本的散布
pyplot.scatter(X[row_ix, 0], X[row_ix, 1])
# 绘制散点图
pyplot.show()
运行该示例符合训练数据集上的模型,并预测数据集中每个示例的群集。然后创建一个散点图,并由其指定的群集着色。在这种情况下,尽管需要更多的调整,但是找到了合理的分组。
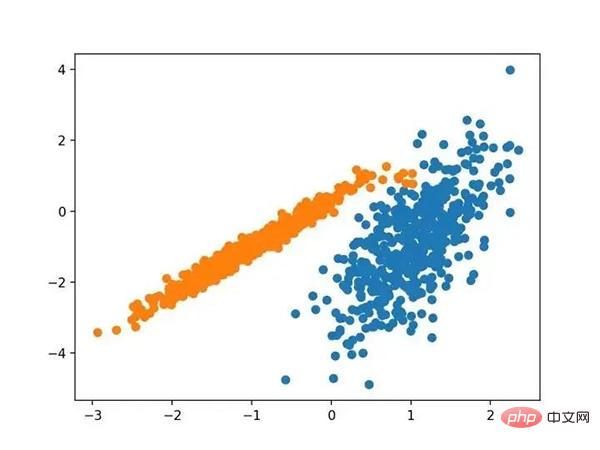
使用DBSCAN集群识别出具有集群的数据集的散点图
K-均值聚类可以是最常见的聚类算法,并涉及向群集分配示例,以尽量减少每个群集内的方差。
它是通过 K-均值类实现的,要优化的主要配置是“ n _ clusters ”超参数设置为数据中估计的群集数量。下面列出了完整的示例。
# k-means 聚类
from numpy import unique
from numpy import where
from sklearn.datasets import make_classification
from sklearn.cluster import KMeans
from matplotlib import pyplot
# 定义数据集
X, _ = make_classification(n_samples=1000, n_features=2, n_informative=2, n_redundant=0, n_clusters_per_class=1, random_state=4)
# 定义模型
model = KMeans(n_clusters=2)
# 模型拟合
model.fit(X)
# 为每个示例分配一个集群
yhat = model.predict(X)
# 检索唯一群集
clusters = unique(yhat)
# 为每个群集的样本创建散点图
for cluster in clusters:
# 获取此群集的示例的行索引
row_ix = where(yhat == cluster)
# 创建这些样本的散布
pyplot.scatter(X[row_ix, 0], X[row_ix, 1])
# 绘制散点图
pyplot.show()
运行该示例符合训练数据集上的模型,并预测数据集中每个示例的群集。然后创建一个散点图,并由其指定的群集着色。在这种情况下,可以找到一个合理的分组,尽管每个维度中的不等等方差使得该方法不太适合该数据集。
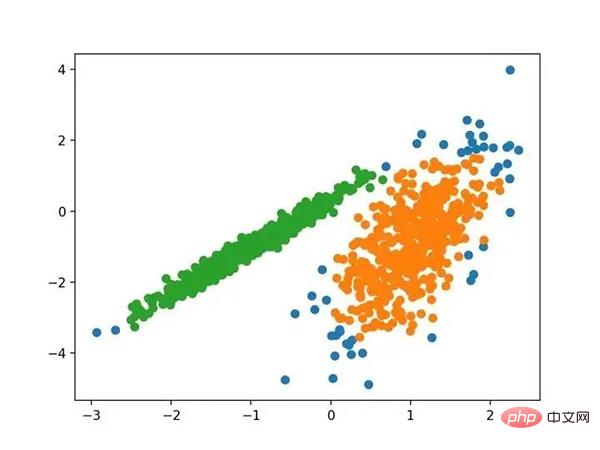
使用K均值聚类识别出具有聚类的数据集的散点图
Mini-Batch K-均值是 K-均值的修改版本,它使用小批量的样本而不是整个数据集对群集质心进行更新,这可以使大数据集的更新速度更快,并且可能对统计噪声更健壮。
它是通过 MiniBatchKMeans 类实现的,要优化的主配置是“ n _ clusters ”超参数,设置为数据中估计的群集数量。下面列出了完整的示例。
# mini-batch k均值聚类
from numpy import unique
from numpy import where
from sklearn.datasets import make_classification
from sklearn.cluster import MiniBatchKMeans
from matplotlib import pyplot
# 定义数据集
X, _ = make_classification(n_samples=1000, n_features=2, n_informative=2, n_redundant=0, n_clusters_per_class=1, random_state=4)
# 定义模型
model = MiniBatchKMeans(n_clusters=2)
# 模型拟合
model.fit(X)
# 为每个示例分配一个集群
yhat = model.predict(X)
# 检索唯一群集
clusters = unique(yhat)
# 为每个群集的样本创建散点图
for cluster in clusters:
# 获取此群集的示例的行索引
row_ix = where(yhat == cluster)
# 创建这些样本的散布
pyplot.scatter(X[row_ix, 0], X[row_ix, 1])
# 绘制散点图
pyplot.show()
运行该示例符合训练数据集上的模型,并预测数据集中每个示例的群集。然后创建一个散点图,并由其指定的群集着色。在这种情况下,会找到与标准 K-均值算法相当的结果。
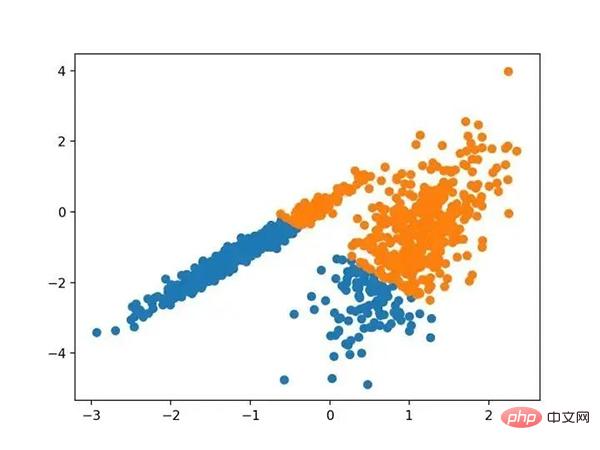
带有最小批次K均值聚类的聚类数据集的散点图
均值漂移聚类涉及到根据特征空间中的实例密度来寻找和调整质心。
它是通过 MeanShift 类实现的,主要配置是“带宽”超参数。下面列出了完整的示例。
# 均值漂移聚类
from numpy import unique
from numpy import where
from sklearn.datasets import make_classification
from sklearn.cluster import MeanShift
from matplotlib import pyplot
# 定义数据集
X, _ = make_classification(n_samples=1000, n_features=2, n_informative=2, n_redundant=0, n_clusters_per_class=1, random_state=4)
# 定义模型
model = MeanShift()
# 模型拟合与聚类预测
yhat = model.fit_predict(X)
# 检索唯一群集
clusters = unique(yhat)
# 为每个群集的样本创建散点图
for cluster in clusters:
# 获取此群集的示例的行索引
row_ix = where(yhat == cluster)
# 创建这些样本的散布
pyplot.scatter(X[row_ix, 0], X[row_ix, 1])
# 绘制散点图
pyplot.show()
运行该示例符合训练数据集上的模型,并预测数据集中每个示例的群集。然后创建一个散点图,并由其指定的群集着色。在这种情况下,可以在数据中找到一组合理的群集。
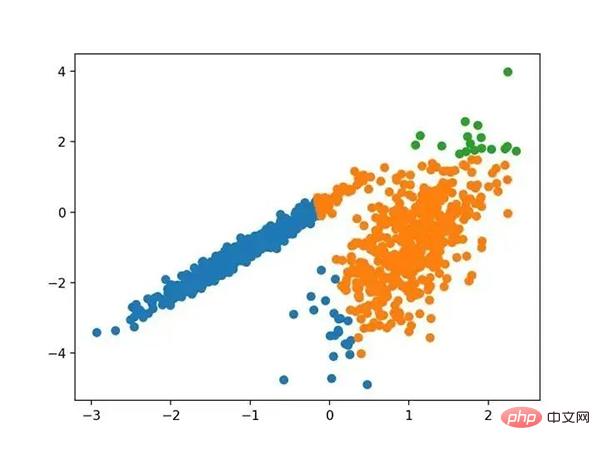
具有均值漂移聚类的聚类数据集散点图
OPTICS 聚类( OPTICS 短于订购点数以标识聚类结构)是上述 DBSCAN 的修改版本。
它是通过 OPTICS 类实现的,主要配置是“ eps ”和“ min _ samples ”超参数。下面列出了完整的示例。
# optics聚类
from numpy import unique
from numpy import where
from sklearn.datasets import make_classification
from sklearn.cluster import OPTICS
from matplotlib import pyplot
# 定义数据集
X, _ = make_classification(n_samples=1000, n_features=2, n_informative=2, n_redundant=0, n_clusters_per_class=1, random_state=4)
# 定义模型
model = OPTICS(eps=0.8, min_samples=10)
# 模型拟合与聚类预测
yhat = model.fit_predict(X)
# 检索唯一群集
clusters = unique(yhat)
# 为每个群集的样本创建散点图
for cluster in clusters:
# 获取此群集的示例的行索引
row_ix = where(yhat == cluster)
# 创建这些样本的散布
pyplot.scatter(X[row_ix, 0], X[row_ix, 1])
# 绘制散点图
pyplot.show()
运行该示例符合训练数据集上的模型,并预测数据集中每个示例的群集。然后创建一个散点图,并由其指定的群集着色。在这种情况下,我无法在此数据集上获得合理的结果。
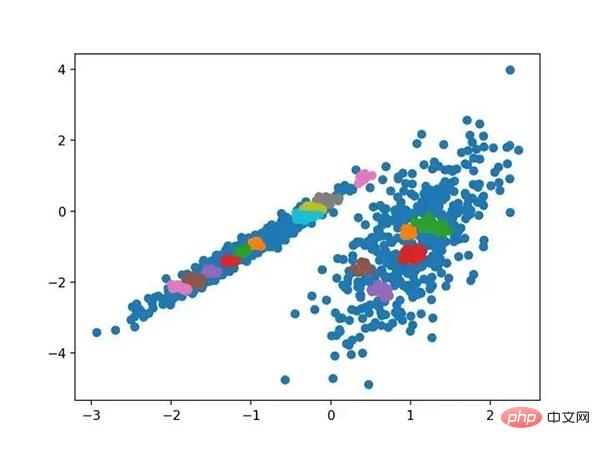
使用OPTICS聚类确定具有聚类的数据集的散点图
光谱聚类是一类通用的聚类方法,取自线性线性代数。
它是通过 Spectral 聚类类实现的,而主要的 Spectral 聚类是一个由聚类方法组成的通用类,取自线性线性代数。要优化的是“ n _ clusters ”超参数,用于指定数据中的估计群集数量。下面列出了完整的示例。
# spectral clustering
from numpy import unique
from numpy import where
from sklearn.datasets import make_classification
from sklearn.cluster import SpectralClustering
from matplotlib import pyplot
# 定义数据集
X, _ = make_classification(n_samples=1000, n_features=2, n_informative=2, n_redundant=0, n_clusters_per_class=1, random_state=4)
# 定义模型
model = SpectralClustering(n_clusters=2)
# 模型拟合与聚类预测
yhat = model.fit_predict(X)
# 检索唯一群集
clusters = unique(yhat)
# 为每个群集的样本创建散点图
for cluster in clusters:
# 获取此群集的示例的行索引
row_ix = where(yhat == cluster)
# 创建这些样本的散布
pyplot.scatter(X[row_ix, 0], X[row_ix, 1])
# 绘制散点图
pyplot.show()
运行该示例符合训练数据集上的模型,并预测数据集中每个示例的群集。然后创建一个散点图,并由其指定的群集着色。
在这种情况下,找到了合理的集群。
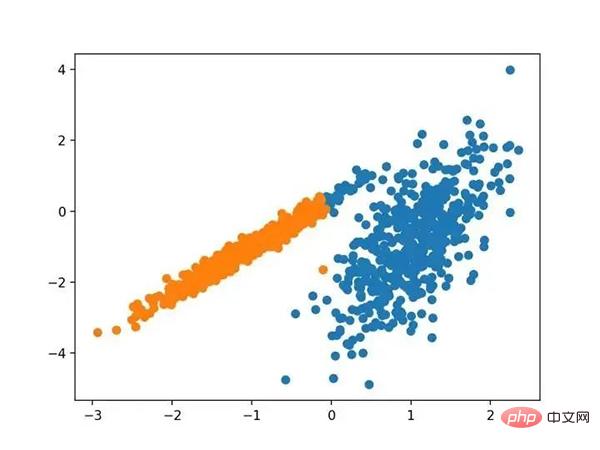
使用光谱聚类聚类识别出具有聚类的数据集的散点图
高斯混合模型总结了一个多变量概率密度函数,顾名思义就是混合了高斯概率分布。它是通过 Gaussian Mixture 类实现的,要优化的主要配置是“ n _ clusters ”超参数,用于指定数据中估计的群集数量。下面列出了完整的示例。
# 高斯混合模型
from numpy import unique
from numpy import where
from sklearn.datasets import make_classification
from sklearn.mixture import GaussianMixture
from matplotlib import pyplot
# 定义数据集
X, _ = make_classification(n_samples=1000, n_features=2, n_informative=2, n_redundant=0, n_clusters_per_class=1, random_state=4)
# 定义模型
model = GaussianMixture(n_components=2)
# 模型拟合
model.fit(X)
# 为每个示例分配一个集群
yhat = model.predict(X)
# 检索唯一群集
clusters = unique(yhat)
# 为每个群集的样本创建散点图
for cluster in clusters:
# 获取此群集的示例的行索引
row_ix = where(yhat == cluster)
# 创建这些样本的散布
pyplot.scatter(X[row_ix, 0], X[row_ix, 1])
# 绘制散点图
pyplot.show()
运行该示例符合训练数据集上的模型,并预测数据集中每个示例的群集。然后创建一个散点图,并由其指定的群集着色。在这种情况下,我们可以看到群集被完美地识别。这并不奇怪,因为数据集是作为 Gaussian 的混合生成的。
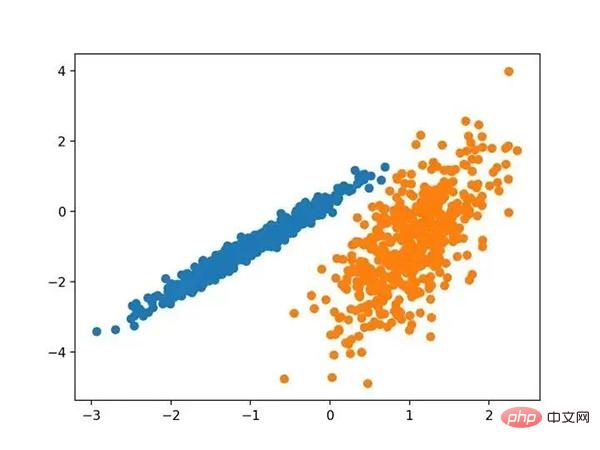
使用高斯混合聚类识别出具有聚类的数据集的散点图
在本教程中,您发现了如何在 python 中安装和使用顶级聚类算法。具体来说,你学到了:
以上是十種聚類演算法的完整 Python 操作範例的詳細內容。更多資訊請關注PHP中文網其他相關文章!


