我們知道 Pandas 是 Python 中最廣泛使用的資料分析和操作函式庫。它提供了許多功能和方法,可以快速解決資料分析中資料處理問題。
為了更好的掌握 Python 函數的使用方法,我以客戶流失資料集為例,分享30個在資料分析過程中最常使用的函數和方法,資料文末可以下載。
資料如下所示:
import numpy as np
import pandas as pd
df = pd.read_csv("Churn_Modelling.csv")
print(df.shape)
df.columns
結果輸出
(10000, 14)
Index(['RowNumber', 'CustomerId', 'Surname', 'CreditScore', 'Geography','Gender', 'Age', 'Tenure', 'Balance', 'NumOfProducts', 'HasCrCard','IsActiveMember', 'EstimatedSalary', 'Exited'],dtype='object')
df.drop(['RowNumber', 'CustomerId', 'Surname', 'CreditScore'], axis=1, inplace=True)
print(df[:2])
print(df.shape)
結果輸出
說明:「axis ” 參數設定為1 以放置列,0 設定為行。 “inplace=True” 參數設定為 True 以儲存變更。我們減了 4 列,因此列數從 14 個減少到 10 列。
GeographyGenderAgeTenureBalanceNumOfProductsHasCrCard
0FranceFemale 42 20.011
 IsActiveMemberEstimatedSalaryExited
0 1101348.88 1
(10000, 10)
我們從 csv 檔案讀取部分列資料。可以使用 usecols 參數。
df_spec = pd.read_csv("Churn_Modelling.csv", usecols=['Gender', 'Age', 'Tenure', 'Balance'])
df_spec.head()
可以使用 nrows 參數,建立了一個包含 csv 檔案前 5000 行的資料幀。也可以使用 skiprows 參數從檔案結尾選擇行。 Skiprows=5000 表示我們將在讀取 csv 檔案時跳過前 5000 行。
df_partial = pd.read_csv("Churn_Modelling.csv", nrows=5000)
print(df_partial.shape)
建立資料框後,我們可能需要一個小樣本來測試資料。我們可以使用 n 或 frac 參數來決定樣本大小。
df= pd.read_csv("Churn_Modelling.csv", usecols=['Gender', 'Age', 'Tenure', 'Balance'])
df_sample = df.sample(n=1000)
df_sample2 = df.sample(frac=0.1)
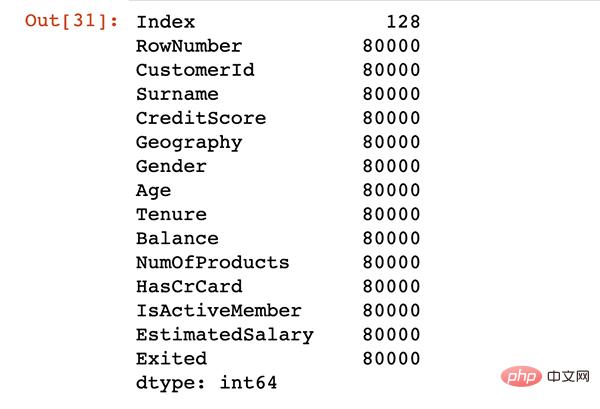
isna 函數決定資料幀中缺少的值。透過將 isna 與 sum 函數一起使用,我們可以看到每個欄位中缺失值的數量。
df.isna().sum()
使用loc 和iloc 新增缺失值,兩者差異如下:
missing_index = np.random.randint(10000, size=20)
df.loc[missing_index, ['Balance','Geography']] = np.nan
df.iloc[missing_index, -1] = np.nan
avg = df['Balance'].mean()
df['Balance'].fillna(value=avg, inplace=True)
df.dropna(axis=0, how='any', inplace=True)
france_churn = df[(df.Geography == 'France') & (df.Exited == 1)]
france_churn.Geography.value_counts()
df2 = df.query('80000 < Balance < 100000')
df2 = df.query('80000 < Balance < 100000'
df2 = df.query('80000 < Balance < 100000')
df[df['Tenure'].isin([4,6,9,10])][:3]

df[['Geography','Gender','Exited']].groupby(['Geography','Gender']).mean()
df[['Geography','Gender','Exited']].groupby(['Geography','Gender']).agg(['mean','count'])
df_summary = df[['Geography','Exited','Balance']].groupby('Geography').agg({'Exited':'sum', 'Balance':'mean'})
df_summary.rename(columns={'Exited':'# of churned customers', 'Balance':'Average Balance of Customers'},inplace=True)
import pandas as pd
df_summary = df[['Geography','Exited','Balance']].groupby('Geography').agg(Number_of_churned_customers = pd.NamedAgg('Exited', 'sum'),Average_balance_of_customers = pd.NamedAgg('Balance', 'mean'))
print(df_summary)

print(df_summary.reset_index())

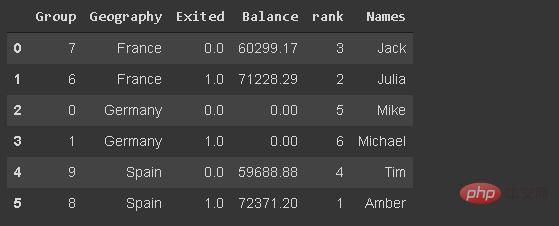
df[['Geography','Exited','Balance']].sample(n=6).reset_index(drop=True)
df_new.set_index('Geography')
group = np.random.randint(10, size=6)
df_new['Group'] = group
df_new['Balance'] = df_new['Balance'].where(df_new['Group'] >= 6, 0)
df_new['rank'] = df_new['Balance'].rank(method='first', ascending=False).astype('int')
df.Geography.nunique
df.memory_usage()

默认情况下,分类数据与对象数据类型一起存储。但是,它可能会导致不必要的内存使用,尤其是当分类变量具有较低的基数。
低基数意味着列与行数相比几乎没有唯一值。例如,地理列具有 3 个唯一值和 10000 行。
我们可以通过将其数据类型更改为"类别"来节省内存。
df['Geography'] = df['Geography'].astype('category')
替换函数可用于替换数据帧中的值。
df['Geography'].replace({0:'B1',1:'B2'})
pandas 不是一个数据可视化库,但它使得创建基本绘图变得非常简单。
我发现使用 Pandas 创建基本绘图更容易,而不是使用其他数据可视化库。
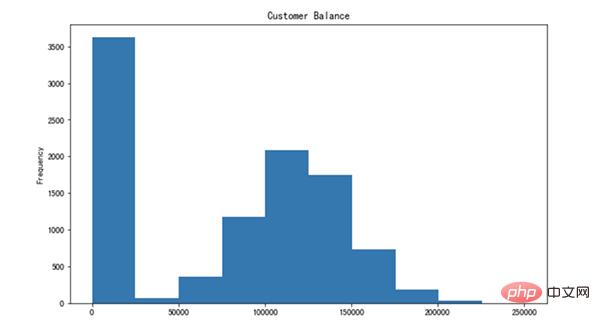
让我们创建平衡列的直方图。

pandas 可能会为浮点数显示过多的小数点。我们可以轻松地调整它。
df['Balance'].plot(kind='hist', figsize=(10,6),
title='Customer Balance')
我们可以更改各种参数的默认显示选项,而不是每次手动调整显示选项。
pd.set_option("display.precision", 2)
可能要更改的一些其他选项包括:
pct_change用于计算序列中值的变化百分比。在计算时间序列或元素顺序数组中更改的百分比时,它很有用。
ser= pd.Series([2,4,5,6,72,4,6,72])
ser.pct_change()
我们可能需要根据文本数据(如客户名称)筛选观测值(行)。我已经在数据帧中添加了df_new名称。

df_new[df_new.Names.str.startswith('Mi')]
我们可能需要根据文本数据(如客户名称)筛选观测值(行)。我已经在数据帧中添加了df_new名称。

我们可以通过使用返回 Style 对象的 Style 属性来实现此目的,它提供了许多用于格式化和显示数据框的选项。例如,我们可以突出显示最小值或最大值。
它还允许应用自定义样式函数。
df_new.style.highlight_max(axis=0, color='darkgreen')

以上是三十個 Python 函數,解決99%的資料處理任務!的詳細內容。更多資訊請關注PHP中文網其他相關文章!


