目錄
1、資料取得
請求網站連結
提取有用資訊
儲存csv檔案
2.可視化分析
#當天溫度變化曲線圖
當天相對濕度變化曲線圖
溫濕度相關性分析圖
空氣品質指數長條圖
風向風級雷達圖
未來14天高低溫變化曲線圖
未來14天風向風級雷達圖
未來14天氣候分佈圓餅圖
3、結論
4、代码框架
附源代码
首頁 後端開發 Python教學 Python爬取天氣資料及視覺化分析的方法是什麼

Python爬取天氣資料及視覺化分析的方法是什麼

Apr 26, 2023 pm 03:19 PM
python

1、資料取得

請求網站連結

先查看中國天氣網,這裡就造訪本地的天氣網址,如果想爬取不同的地區只要修改最後的101280701地區編號即可,前面的weather代表是7天的網頁,weather1d代表當天,weather15d代表未來14天。這裡就主要訪問7天和14天的中國天氣網。採用requests.get()方法,請求網頁,如果成功訪問,則得到的是網頁的所有字串文字。這就是請求過程。

1

2

3

4

5

6

7

8

9

10

11

def getHTMLtext(url):

"""请求获得网页内容"""

 try:

r = requests.get(url, timeout = 30)

r.raise_for_status()

r.encoding = r.apparent_encoding

print("成功访问")

return r.text

 except:

print("访问错误")

 return" "

登入後複製
提取有用資訊

這裡採用BeautifulSoup庫對剛剛取得的字串進行資料擷取,首先對網頁進行檢查,找到需要取得資料的標籤:

Python爬取天氣資料及視覺化分析的方法是什麼

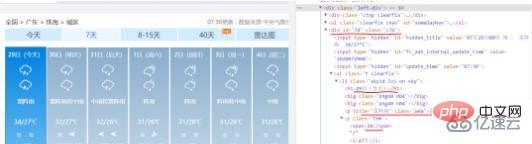
可以發現7天的資料資訊在div標籤中且id=“7d”,且日期、天氣、溫度、風級等資訊都在ul和li標籤中,所以我們可以使用BeautifulSoup將取得的網頁文字尋找div標籤id=“7d”,找出他包含的所有的ul和li標籤,之後提取標籤中對應的資料值,儲存到對應清單中。

這裡要注意一個細節就是有時日期沒有最高氣溫,對於沒有資料的情況要進行判斷和處理。另外對於一些資料保存的格式也要提前進行處理,例如溫度後面的攝氏度符號,日期數字的提取,和風級文字的提取,這需要用到字符查找及字符串切片處理。

1

2

3

4

5

6

def get_content(html):

"""处理得到有用信息保存数据文件"""

final = []# 初始化一个列表保存数据

bs = BeautifulSoup(html, "html.parser")# 创建BeautifulSoup对象

body = bs.body

data = body.find('div', {'id': '7d'})# 找到div标签且id = 7d

登入後複製

下面爬取當天的數據

1

2

3

4

5

6

7

8

9

10

11

12

13

14

15

16

17

18

19

20

data2 = body.find_all('div',{'class':'left-div'})

text = data2[2].find('script').string

text = text[text.index('=')+1 :-2] # 移除改var data=将其变为json数据

jd = json.loads(text)

dayone = jd['od']['od2'] # 找到当天的数据

final_day = [] # 存放当天的数据

count = 0

for i in dayone:

temp = []

if count <=23:

temp.append(i[&#39;od21&#39;]) # 添加时间

temp.append(i[&#39;od22&#39;]) # 添加当前时刻温度

temp.append(i[&#39;od24&#39;]) # 添加当前时刻风力方向

temp.append(i[&#39;od25&#39;]) # 添加当前时刻风级

temp.append(i[&#39;od26&#39;]) # 添加当前时刻降水量

temp.append(i[&#39;od27&#39;]) # 添加当前时刻相对湿度

temp.append(i[&#39;od28&#39;]) # 添加当前时刻控制质量

#print(temp)

final_day.append(temp)

count = count +1

登入後複製

下面爬取7天的數據

1

2

3

4

5

6

7

8

9

10

11

12

13

14

15

16

17

18

19

20

21

22

23

24

25

26

27

28

29

30

ul = data.find(&#39;ul&#39;)# 找到所有的ul标签

li = ul.find_all(&#39;li&#39;)# 找到左右的li标签

i = 0 # 控制爬取的天数

for day in li:# 遍历找到的每一个li

if i < 7 and i > 0:

temp = []# 临时存放每天的数据

date = day.find(&#39;h2&#39;).string # 得到日期

date = date[0:date.index(&#39;日&#39;)] # 取出日期号

temp.append(date)

inf = day.find_all(&#39;p&#39;)# 找出li下面的p标签,提取第一个p标签的值,即天气

temp.append(inf[0].string)

 tem_low = inf[1].find(&#39;i&#39;).string # 找到最低气温

 if inf[1].find(&#39;span&#39;) is None: # 天气预报可能没有最高气温

 tem_high = None

 else:

 tem_high = inf[1].find(&#39;span&#39;).string# 找到最高气温

 temp.append(tem_low[:-1])

 if tem_high[-1] == &#39;℃&#39;:

temp.append(tem_high[:-1])

 else:

temp.append(tem_high)

 wind = inf[2].find_all(&#39;span&#39;)# 找到风向

 for j in wind:

temp.append(j[&#39;title&#39;])

 wind_scale = inf[2].find(&#39;i&#39;).string # 找到风级

 index1 = wind_scale.index(&#39;级&#39;)

 temp.append(int(wind_scale[index1-1:index1]))

 final.append(temp)

i = i + 1

return final_day,final

登入後複製

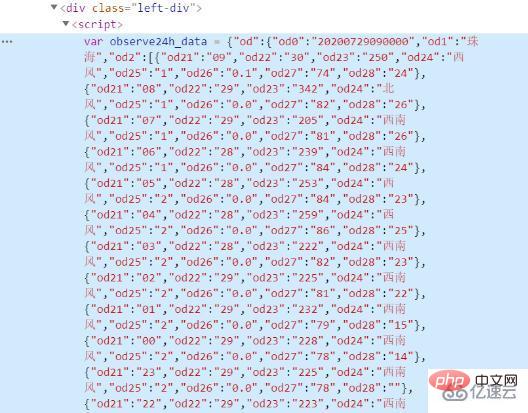
同樣對於/weather15d:15天的信息,也做同樣的處理,這裡經過查看後發現他的15天網頁中只有8-14天,前面的1-7天在/weather中,這裡就分別訪問兩個網頁將爬取得到的數據進行合併得到最終14天的數據。 -  前面是未來14天的數據爬取過程,對於當天24小時的天氣資訊數據,經過查找發現他是一個json數據,可以透過json.loads()方法獲取當天的數據,進而對當天的天氣資訊進行提取。

Python爬取天氣資料及視覺化分析的方法是什麼

儲存csv檔案

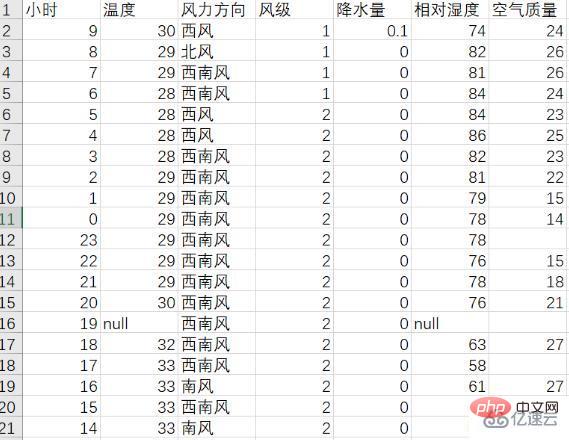
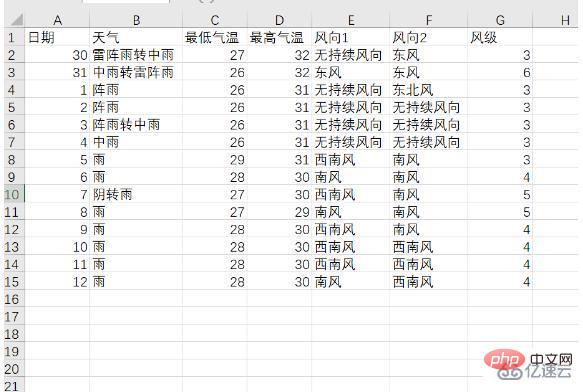
前面將爬取的資料加入到列表中,這裡引入csv函式庫,利用f_csv.writerow(header)和f_csv. writerows(data)方法,分別寫入表頭和每一行的數據,這裡將1天和未來14天的數據分開存儲,分別保存為weather1.csv和weather14.csv,下面是他們保存的表格圖:

Python爬取天氣資料及視覺化分析的方法是什麼

Python爬取天氣資料及視覺化分析的方法是什麼

2.可視化分析

#當天溫度變化曲線圖

採用matplotlib中plt.plot ()方法繪製出一天24小時的溫度變化曲線,並用plt.text()方法點出最高溫和最低溫,並畫出平均溫度線,下圖為溫度變化曲線圖:(代碼見附錄)

屌啊!接私活必備的 N 個開源專案!趕快收藏吧

Python爬取天氣資料及視覺化分析的方法是什麼

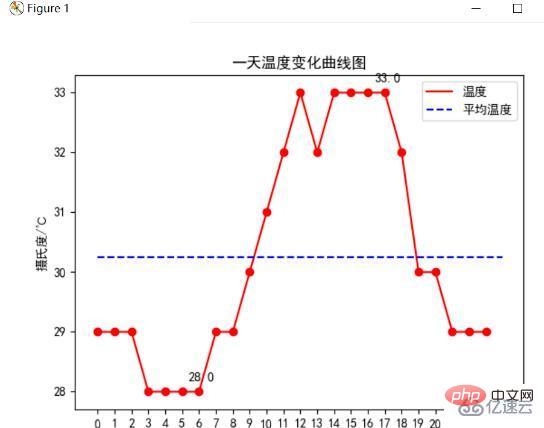
分析可以發現這一天最高溫度為33℃,最低溫度為28℃,且平均溫度在20.4℃左右,透過對時間分析,發現晝夜溫差5℃,低溫分佈在凌晨,高溫分佈在中午到下午的時段。

當天相對濕度變化曲線圖

採用matplotlib中plt.plot()方法繪製出一天24小時的濕度變化曲線,並畫出平均相對濕度線,下圖為濕度變化曲線圖:(代碼見附錄)

Python爬取天氣資料及視覺化分析的方法是什麼

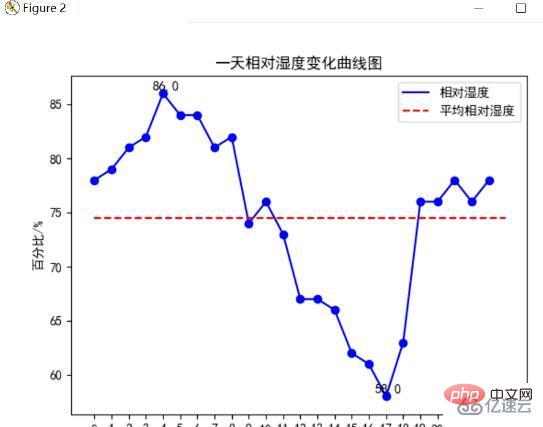
分析可以發現這一天最高相對濕度為86%,最低相對濕度為58℃,且平均相對濕度在75%左右,透過對時間分析,清晨的濕度比較大,而下午至黃昏濕度較小。

溫濕度相關性分析圖

經過前面兩個圖的分析我們可以感覺到溫度和濕度之間是有關係的,為了更清楚直觀地感受這種關係,使用plt.scatter()方法將溫度為橫座標、濕度為縱座標,每個時刻的點在圖中點出來,並且計算相關係數,下圖為結果圖:

Python爬取天氣資料及視覺化分析的方法是什麼

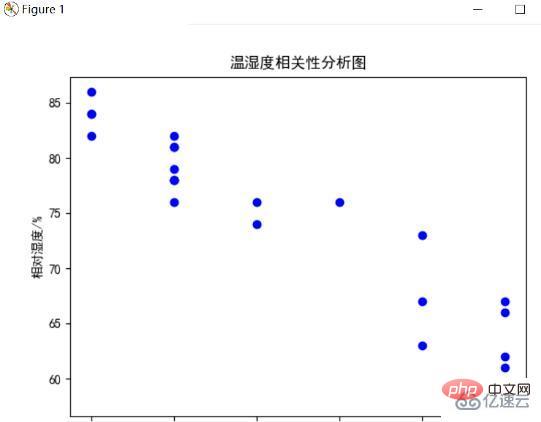
分析可以發現一天的溫度和濕度有強烈的相關性,他們呈現負相關,這表示他們時間是負相關關係,並且進一步分析,當溫度較低時,空氣中水分含量較多,濕度自然較高,而溫度較高時,水分蒸發,空氣就比較乾燥,濕度較低,符合平時氣候現象。
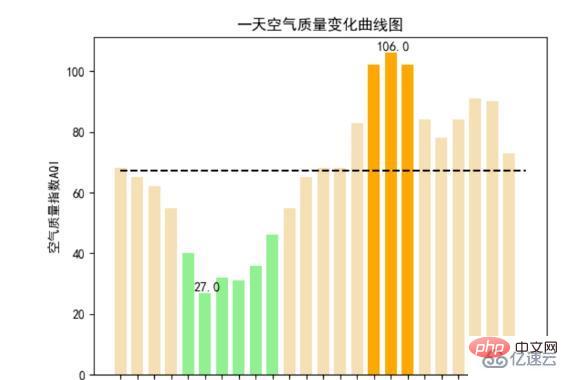
空氣品質指數長條圖

空氣品質指數AQI是定量描述空氣品質狀況的指數,其數值越大說明空氣污染狀況越重,對人體健康的危害就越大。一般將空氣品質指數分為6個等級,等級越高說明污染越嚴重,下面使用plt.bar方法對一天24小時的空氣品質進行了長條圖繪製,並且根據6個等級的不同,相應的柱狀圖的顏色也從淺到深,也顯示污染逐步加重,更直觀的顯示污染情況,並且也將最高和最低的空氣質量指數標出,用虛線畫出平均的空氣質量指數,下圖是繪製結果圖:

Python爬取天氣資料及視覺化分析的方法是什麼

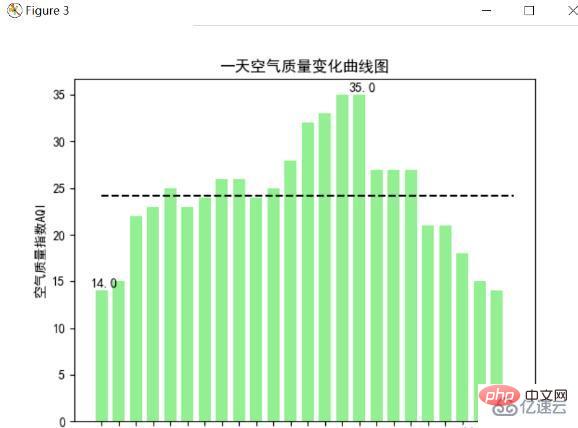
上面這張是南方珠海的控製品質圖,可以看出空氣品質指數最大也是在健康範圍,說明珠海空氣非常好,分析可以發現這一天最高空氣品質指數達到了35,最低則只有14,並且平均在25左右,通過時間也可以發現,基本上在清晨的時候是空氣最好的時候(4-9點),在下午是空氣污染最嚴重的時候,所以清晨一般可以去外面呼吸新鮮的空氣,那時污染最小。

而下面這個空氣品質圖是選取的北方的一個城市,可以看到這裡的環境遠遠比不上珠海。

Python爬取天氣資料及視覺化分析的方法是什麼

風向風級雷達圖

統計一天的風力和風向,由於風力風向使用極座標的方式展現較好,所以這裡採用的是極座標的方式展現一天的風力風向圖,將圓分為8份,每一份代表一個風向,半徑代表平均風力,並且隨著風級增高,藍色加深,最後結果如下所示:

Python爬取天氣資料及視覺化分析的方法是什麼

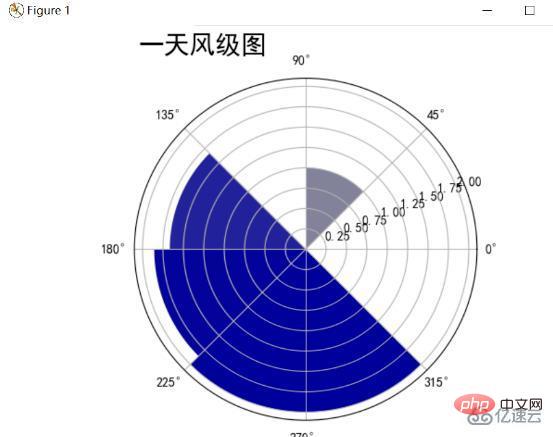
分析可以發現這一天西南風最多,平均風級達到了1.75級,東北風也有小部分1.0級,其餘空白方向無來風。

未來14天高低溫變化曲線圖

統計未來14天的高低溫變化,並繪製出他們的變化曲線圖,分別用虛線將他們的平均氣溫線繪製出來,最後結果如下所示:

Python爬取天氣資料及視覺化分析的方法是什麼

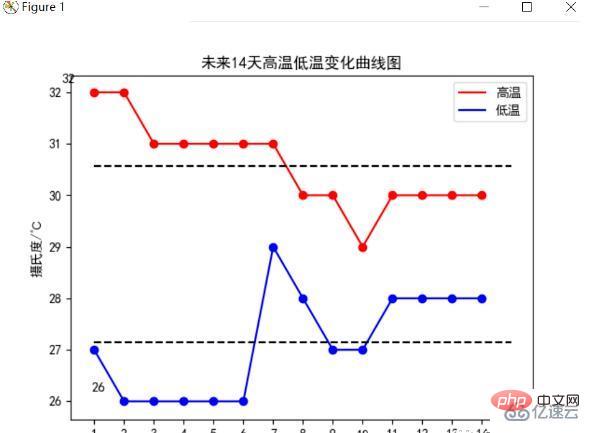
分析可以發現未來14天高溫平均氣溫為30.5℃,溫度還是比較高,但未來的第8天有降溫,需要做好降溫準備,低溫前方處於穩定趨勢,等到第8天開始下降,伴隨著高溫也下降,整體溫度下降,低溫平均在27℃左右。

未來14天風向風級雷達圖

統計未來14天的風向和平均風力,並和前面一樣採用極座標形式,將圓週分為8個部分,代表8個方向,顏色越深代表風級越高,最後結果如下所示:

Python爬取天氣資料及視覺化分析的方法是什麼

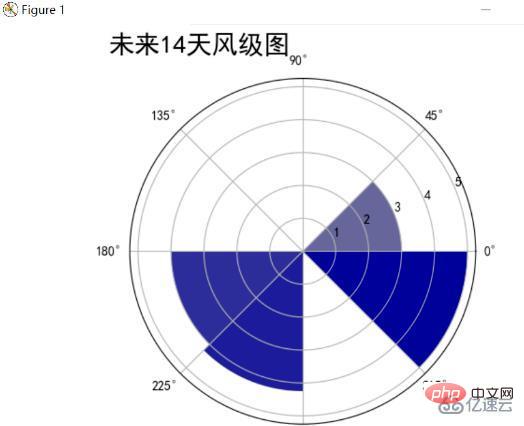
分析可以發現未來14天東南風、西南風所佔主要風向,風級最高達到了5級,最低的西風平均風級也有3級。

未來14天氣候分佈圓餅圖

統計未來14天的氣候,並求每個氣候的總天數,最後將各氣候的圓餅圖繪製出來,結果如下所示:

Python爬取天氣資料及視覺化分析的方法是什麼

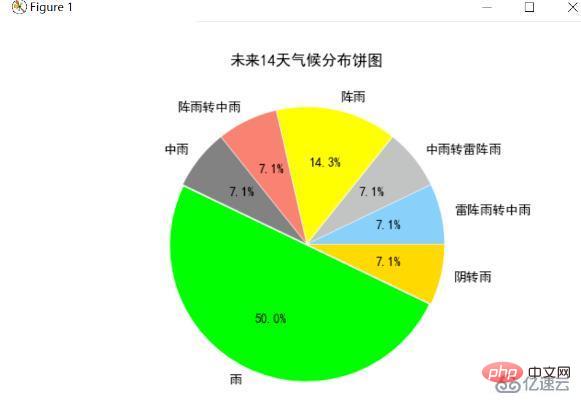
分析可以發現未來14天氣候基本上是“雨”、“陰轉雨”和“陣雨”,下雨的天數較多,結合前面的氣溫分佈圖可看出在第8-9天氣高溫下降,可以推測當天下雨,導致氣溫下降。

3、結論

1.首先根據爬取的溫濕度資料進行的分析,溫度從早上低到中午高再到晚上低,濕度和溫度的趨勢相反,透過相關係數發現溫度和濕度有強烈的負相關關係,經查閱資料發現因為隨著溫度升高水蒸汽蒸發加劇,空氣中水分降低濕度降低。當然,濕度同時受氣壓和雨水的影響,下雨濕度會明顯增加。

2.经查阅资料空气质量不仅跟工厂、汽车等排放的烟气、废气等有关,更为重要的是与气象因素有关。由于昼夜温差明显变化,当地面温度高于高空温度时,空气上升,污染物易被带到高空扩散;当地面温度低于一定高度的温度时,天空形成逆温层,它像一个大盖子一样压在地面上空,使地表空气中各种污染物不易扩散。一般在晚间和清晨影响较大,而当太阳出来后,地面迅速升温,逆温层就会逐渐消散,于是污染空气也就扩散了。

3.风是由气压在水平方向分布的不均匀导致的。风受大气环流、地形、水域等不同因素的综合影响,表现形式多种多样,如季风、地方性的海陆风、山谷风等,一天的风向也有不同的变化,根据未来14天的风向雷达图可以发现未来所有风向基本都有涉及,并且没有特别的某个风向,原因可能是近期没有降水和气文变化不大,导致风向也没有太大的变化规律。

4.天气是指某一个地区距离地表较近的大气层在短时间内的具体状态。跟某瞬时内大气中各种气象要素分布的综合表现。根据未来14天的天气和温度变化可以大致推断出某个时间的气候,天气和温度之间也是有联系的。
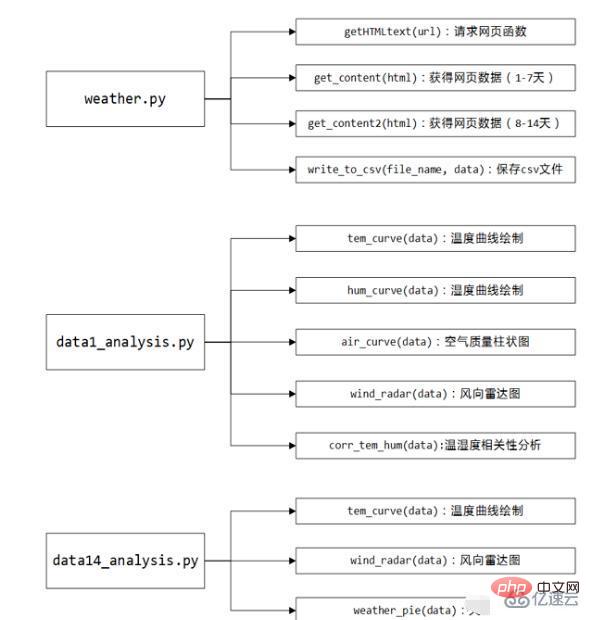
4、代码框架

代码主要分为weather.py:对中国天气网进行爬取天气数据并保存csv文件;data1_analysis.py:对当天的天气信息进行可视化处理;data14_analysis.py:对未来14天的天气信息进行可视化处理。下面是代码的结构图:

Python爬取天氣資料及視覺化分析的方法是什麼

附源代码

weather.py

1

2

3

4

5

6

7

8

9

10

11

12

13

14

15

16

17

18

19

20

21

22

23

24

25

26

27

28

29

30

31

32

33

34

35

36

37

38

39

40

41

42

43

44

45

46

47

48

49

50

51

52

53

54

55

56

57

58

59

60

61

62

63

64

65

66

67

68

69

70

71

72

73

74

75

76

77

78

79

80

81

82

83

84

85

86

87

88

89

90

91

92

93

94

95

96

97

98

99

100

101

102

103

104

105

106

107

108

109

110

111

112

113

114

115

116

117

118

119

120

121

122

123

124

125

126

127

128

129

130

131

132

133

134

# weather.py

import requests

from bs4 import BeautifulSoup

import csv

import json

def getHTMLtext(url):

"""请求获得网页内容"""

 try:

r = requests.get(url, timeout = 30)

r.raise_for_status()

r.encoding = r.apparent_encoding

print("成功访问")

return r.text

 except:

print("访问错误")

return" "

def get_content(html):

"""处理得到有用信息保存数据文件"""

final = []# 初始化一个列表保存数据

bs = BeautifulSoup(html, "html.parser")# 创建BeautifulSoup对象

body = bs.body

data = body.find(&#39;div&#39;, {&#39;id&#39;: &#39;7d&#39;})# 找到div标签且id = 7d

# 下面爬取当天的数据

data2 = body.find_all('div',{'class':'left-div'})

text = data2[2].find('script').string

text = text[text.index('=')+1 :-2] # 移除改var data=将其变为json数据

jd = json.loads(text)

dayone = jd['od']['od2'] # 找到当天的数据

final_day = [] # 存放当天的数据

count = 0

for i in dayone:

 temp = []

 if count <=23:

temp.append(i['od21']) # 添加时间

temp.append(i['od22']) # 添加当前时刻温度

temp.append(i['od24']) # 添加当前时刻风力方向

temp.append(i['od25']) # 添加当前时刻风级

temp.append(i['od26']) # 添加当前时刻降水量

temp.append(i['od27']) # 添加当前时刻相对湿度

temp.append(i['od28']) # 添加当前时刻控制质量

#print(temp)

final_day.append(temp)

 count = count +1

 # 下面爬取7天的数据

ul = data.find('ul')# 找到所有的ul标签

li = ul.find_all('li')# 找到左右的li标签

i = 0 # 控制爬取的天数

for day in li:# 遍历找到的每一个li

if i < 7 and i > 0:

temp = []# 临时存放每天的数据

date = day.find('h2').string # 得到日期

date = date[0:date.index('日')] # 取出日期号

temp.append(date)

inf = day.find_all('p')# 找出li下面的p标签,提取第一个p标签的值,即天气

temp.append(inf[0].string)

tem_low = inf[1].find('i').string # 找到最低气温

if inf[1].find('span') is None: # 天气预报可能没有最高气温

tem_high = None

else:

tem_high = inf[1].find('span').string# 找到最高气温

temp.append(tem_low[:-1])

if tem_high[-1] == '℃':

 temp.append(tem_high[:-1])

else:

 temp.append(tem_high)

wind = inf[2].find_all('span')# 找到风向

for j in wind:

 temp.append(j['title'])

wind_scale = inf[2].find('i').string # 找到风级

index1 = wind_scale.index('级')

temp.append(int(wind_scale[index1-1:index1]))

final.append(temp)

i = i + 1

return final_day,final

#print(final)

def get_content2(html):

"""处理得到有用信息保存数据文件"""

final = []# 初始化一个列表保存数据

bs = BeautifulSoup(html, "html.parser")# 创建BeautifulSoup对象

body = bs.body

data = body.find('div', {'id': '15d'})# 找到div标签且id = 15d

ul = data.find('ul')# 找到所有的ul标签

li = ul.find_all('li')# 找到左右的li标签

final = []

i = 0 # 控制爬取的天数

for day in li: # 遍历找到的每一个li

if i < 8:

temp = [] # 临时存放每天的数据

date = day.find('span',{'class':'time'}).string# 得到日期

date = date[date.index('(')+1:-2]# 取出日期号

temp.append(date)

weather = day.find('span',{'class':'wea'}).string# 找到天气

temp.append(weather)

tem = day.find('span',{'class':'tem'}).text# 找到温度

temp.append(tem[tem.index('/')+1:-1]) # 找到最低气温

temp.append(tem[:tem.index('/')-1])# 找到最高气温

wind = day.find('span',{'class':'wind'}).string# 找到风向

if '转' in wind: # 如果有风向变化

 temp.append(wind[:wind.index('转')])

 temp.append(wind[wind.index('转')+1:])

else: # 如果没有风向变化,前后风向一致

 temp.append(wind)

 temp.append(wind)

wind_scale = day.find('span',{'class':'wind1'}).string# 找到风级

index1 = wind_scale.index('级')

temp.append(int(wind_scale[index1-1:index1]))

final.append(temp)

return final

def write_to_csv(file_name, data, day=14):

"""保存为csv文件"""

with open(file_name, 'a', errors='ignore', newline='') as f:

 if day == 14:

header = ['日期','天气','最低气温','最高气温','风向1','风向2','风级']

 else:

header = ['小时','温度','风力方向','风级','降水量','相对湿度','空气质量']

 f_csv = csv.writer(f)

 f_csv.writerow(header)

 f_csv.writerows(data)

def main():

"""主函数"""

print("Weather test")

# 珠海

url1 = 'http://www.weather.com.cn/weather/101280701.shtml'# 7天天气中国天气网

url2 = 'http://www.weather.com.cn/weather15d/101280701.shtml' # 8-15天天气中国天气网

html1 = getHTMLtext(url1)

data1, data1_7 = get_content(html1)# 获得1-7天和当天的数据

html2 = getHTMLtext(url2)

data8_14 = get_content2(html2) # 获得8-14天数据

data14 = data1_7 + data8_14

#print(data)

write_to_csv('weather14.csv',data14,14) # 保存为csv文件

write_to_csv('weather1.csv',data1,1)

if __name__ == '__main__':

main()

登入後複製

data1_analysis.py:

1

2

3

4

5

6

7

8

9

10

11

12

13

14

15

16

17

18

19

20

21

22

23

24

25

26

27

28

29

30

31

32

33

34

35

36

37

38

39

40

41

42

43

44

45

46

47

48

49

50

51

52

53

54

55

56

57

58

59

60

61

62

63

64

65

66

67

68

69

70

71

72

73

74

75

76

77

78

79

80

81

82

83

84

85

86

87

88

89

90

91

92

93

94

95

96

97

98

99

100

101

102

103

104

105

106

107

108

109

110

111

112

113

114

115

116

117

118

119

120

121

122

123

124

125

126

127

128

129

130

131

132

133

134

135

136

137

138

139

140

141

142

143

144

145

146

147

148

149

150

151

152

153

154

155

156

157

158

159

160

161

162

163

164

165

166

167

168

169

170

171

172

173

174

175

176

177

178

179

180

181

182

183

184

185

186

187

188

189

190

191

192

193

194

195

196

197

198

199

200

201

202

203

204

205

206

207

208

209

210

211

212

213

214

215

216

217

218

219

220

221

222

223

224

225

226

227

228

229

230

231

232

233

234

235

236

237

238

239

240

241

242

243

244

245

246

247

248

249

250

251

252

253

254

255

256

257

258

259

260

261

262

263

264

265

266

267

268

269

270

271

272

273

274

275

276

277

278

279

280

281

282

283

284

285

286

287

288

289

290

291

292

293

294

295

296

297

# data1_analysis.py

import matplotlib.pyplot as plt

import numpy as np

import pandas as pd

import math

def tem_curve(data):

"""温度曲线绘制"""

hour = list(data[&#39;小时&#39;])

tem = list(data[&#39;温度&#39;])

for i in range(0,24):

 if math.isnan(tem[i]) == True:

tem[i] = tem[i-1]

 tem_ave = sum(tem)/24 # 求平均温度

tem_max = max(tem)

tem_max_hour = hour[tem.index(tem_max)] # 求最高温度

tem_min = min(tem)

tem_min_hour = hour[tem.index(tem_min)] # 求最低温度

x = []

y = []

for i in range(0, 24):

 x.append(i)

 y.append(tem[hour.index(i)])

plt.figure(1)

plt.plot(x,y,color=&#39;red&#39;,label=&#39;温度&#39;) # 画出温度曲线

plt.scatter(x,y,color=&#39;red&#39;) # 点出每个时刻的温度点

plt.plot([0, 24], [tem_ave, tem_ave], c=&#39;blue&#39;, linestyle=&#39;--&#39;,label=&#39;平均温度&#39;)# 画出平均温度虚线

plt.text(tem_max_hour+0.15, tem_max+0.15, str(tem_max), ha=&#39;center&#39;, va=&#39;bottom&#39;, fontsize=10.5)# 标出最高温度

plt.text(tem_min_hour+0.15, tem_min+0.15, str(tem_min), ha=&#39;center&#39;, va=&#39;bottom&#39;, fontsize=10.5)# 标出最低温度

plt.xticks(x)

plt.legend()

plt.title(&#39;一天温度变化曲线图&#39;)

plt.xlabel(&#39;时间/h&#39;)

plt.ylabel(&#39;摄氏度/℃&#39;)

plt.show()

def hum_curve(data):

"""相对湿度曲线绘制"""

hour = list(data[&#39;小时&#39;])

hum = list(data[&#39;相对湿度&#39;])

for i in range(0,24):

 if math.isnan(hum[i]) == True:

hum[i] = hum[i-1]

 hum_ave = sum(hum)/24 # 求平均相对湿度

hum_max = max(hum)

hum_max_hour = hour[hum.index(hum_max)] # 求最高相对湿度

hum_min = min(hum)

hum_min_hour = hour[hum.index(hum_min)] # 求最低相对湿度

x = []

y = []

for i in range(0, 24):

 x.append(i)

 y.append(hum[hour.index(i)])

plt.figure(2)

plt.plot(x,y,color=&#39;blue&#39;,label=&#39;相对湿度&#39;) # 画出相对湿度曲线

plt.scatter(x,y,color=&#39;blue&#39;) # 点出每个时刻的相对湿度

plt.plot([0, 24], [hum_ave, hum_ave], c=&#39;red&#39;, linestyle=&#39;--&#39;,label=&#39;平均相对湿度&#39;)# 画出平均相对湿度虚线

plt.text(hum_max_hour+0.15, hum_max+0.15, str(hum_max), ha=&#39;center&#39;, va=&#39;bottom&#39;, fontsize=10.5)# 标出最高相对湿度

plt.text(hum_min_hour+0.15, hum_min+0.15, str(hum_min), ha=&#39;center&#39;, va=&#39;bottom&#39;, fontsize=10.5)# 标出最低相对湿度

plt.xticks(x)

plt.legend()

plt.title(&#39;一天相对湿度变化曲线图&#39;)

plt.xlabel(&#39;时间/h&#39;)

plt.ylabel(&#39;百分比/%&#39;)

plt.show()

def air_curve(data):

"""空气质量曲线绘制"""

hour = list(data[&#39;小时&#39;])

air = list(data[&#39;空气质量&#39;])

print(type(air[0]))

for i in range(0,24):

 if math.isnan(air[i]) == True:

air[i] = air[i-1]

 air_ave = sum(air)/24 # 求平均空气质量

air_max = max(air)

air_max_hour = hour[air.index(air_max)] # 求最高空气质量

air_min = min(air)

air_min_hour = hour[air.index(air_min)] # 求最低空气质量

x = []

y = []

for i in range(0, 24):

 x.append(i)

 y.append(air[hour.index(i)])

plt.figure(3)


for i in range(0,24):

 if y[i] <= 50:

plt.bar(x[i],y[i],color=&#39;lightgreen&#39;,width=0.7)# 1等级

 elif y[i] <= 100:

plt.bar(x[i],y[i],color=&#39;wheat&#39;,width=0.7) # 2等级

 elif y[i] <= 150:

plt.bar(x[i],y[i],color=&#39;orange&#39;,width=0.7) # 3等级

 elif y[i] <= 200:

plt.bar(x[i],y[i],color=&#39;orangered&#39;,width=0.7)# 4等级

 elif y[i]  300:

plt.bar(x[i],y[i],color=&#39;maroon&#39;,width=0.7) # 6等级

plt.plot([0, 24], [air_ave, air_ave], c=&#39;black&#39;, linestyle=&#39;--&#39;)# 画出平均空气质量虚线

plt.text(air_max_hour+0.15, air_max+0.15, str(air_max), ha=&#39;center&#39;, va=&#39;bottom&#39;, fontsize=10.5)# 标出最高空气质量

plt.text(air_min_hour+0.15, air_min+0.15, str(air_min), ha=&#39;center&#39;, va=&#39;bottom&#39;, fontsize=10.5)# 标出最低空气质量

plt.xticks(x)

plt.title(&#39;一天空气质量变化曲线图&#39;)

plt.xlabel(&#39;时间/h&#39;)

plt.ylabel(&#39;空气质量指数AQI&#39;)

plt.show()

def wind_radar(data):

"""风向雷达图"""

wind = list(data[&#39;风力方向&#39;])

wind_speed = list(data[&#39;风级&#39;])

for i in range(0,24):

 if wind[i] == "北风":

wind[i] = 90

 elif wind[i] == "南风":

wind[i] = 270

 elif wind[i] == "西风":

wind[i] = 180

 elif wind[i] == "东风":

wind[i] = 360

 elif wind[i] == "东北风":

wind[i] = 45

 elif wind[i] == "西北风":

wind[i] = 135

 elif wind[i] == "西南风":

wind[i] = 225

 elif wind[i] == "东南风":

wind[i] = 315

degs = np.arange(45,361,45)

temp = []

for deg in degs:

 speed = []

 # 获取 wind_deg 在指定范围的风速平均值数据

 for i in range(0,24):

if wind[i] == deg:

 speed.append(wind_speed[i])

 if len(speed) == 0:

temp.append(0)

 else:

temp.append(sum(speed)/len(speed))

print(temp)

N = 8

theta = np.arange(0.+np.pi/8,2*np.pi+np.pi/8,2*np.pi/8)

# 数据极径

radii = np.array(temp)

# 绘制极区图坐标系

plt.axes(polar=True)

# 定义每个扇区的RGB值(R,G,B),x越大,对应的颜色越接近蓝色

colors = [(1-x/max(temp), 1-x/max(temp),0.6) for x in radii]

plt.bar(theta,radii,width=(2*np.pi/N),bottom=0.0,color=colors)

plt.title(&#39;一天风级图&#39;,x=0.2,fontsize=20)

plt.show()

def calc_corr(a, b):

"""计算相关系数"""

a_avg = sum(a)/len(a)

b_avg = sum(b)/len(b)

cov_ab = sum([(x - a_avg)*(y - b_avg) for x,y in zip(a, b)])

 sq = math.sqrt(sum([(x - a_avg)**2 for x in a])*sum([(x - b_avg)**2 for x in b]))

corr_factor = cov_ab/sq

return corr_factor

def corr_tem_hum(data):

"""温湿度相关性分析"""

tem = data[&#39;温度&#39;]

hum = data[&#39;相对湿度&#39;]

plt.scatter(tem,hum,color=&#39;blue&#39;)

plt.title("温湿度相关性分析图")

plt.xlabel("温度/℃")

plt.ylabel("相对湿度/%")

plt.text(20,40,"相关系数为:"+str(calc_corr(tem,hum)),fontdict={&#39;size&#39;:&#39;10&#39;,&#39;color&#39;:&#39;red&#39;})

plt.show()

print("相关系数为:"+str(calc_corr(tem,hum)))

def main():

plt.rcParams[&#39;font.sans-serif&#39;]=[&#39;SimHei&#39;] # 解决中文显示问题

plt.rcParams[&#39;axes.unicode_minus&#39;] = False# 解决负号显示问题

data1 = pd.read_csv(&#39;weather1.csv&#39;,encoding=&#39;gb2312&#39;)

print(data1)

tem_curve(data1)

hum_curve(data1)

air_curve(data1)

wind_radar(data1)

corr_tem_hum(data1)

if __name__ == &#39;__main__&#39;:

main()

data14_analysis.py:

# data14_analysis.py

import matplotlib.pyplot as plt

import numpy as np

import pandas as pd

import math

def tem_curve(data):

"""温度曲线绘制"""

date = list(data[&#39;日期&#39;])

tem_low = list(data[&#39;最低气温&#39;])

tem_high = list(data[&#39;最高气温&#39;])

for i in range(0,14):

 if math.isnan(tem_low[i]) == True:

tem_low[i] = tem_low[i-1]

 if math.isnan(tem_high[i]) == True:

tem_high[i] = tem_high[i-1]

 tem_high_ave = sum(tem_high)/14 # 求平均高温

 tem_low_ave = sum(tem_low)/14 # 求平均低温


tem_max = max(tem_high)

tem_max_date = tem_high.index(tem_max) # 求最高温度

tem_min = min(tem_low)

tem_min_date = tem_low.index(tem_min) # 求最低温度

x = range(1,15)

plt.figure(1)

plt.plot(x,tem_high,color=&#39;red&#39;,label=&#39;高温&#39;)# 画出高温度曲线

plt.scatter(x,tem_high,color=&#39;red&#39;) # 点出每个时刻的温度点

plt.plot(x,tem_low,color=&#39;blue&#39;,label=&#39;低温&#39;)# 画出低温度曲线

plt.scatter(x,tem_low,color=&#39;blue&#39;) # 点出每个时刻的温度点


plt.plot([1, 15], [tem_high_ave, tem_high_ave], c=&#39;black&#39;, linestyle=&#39;--&#39;)# 画出平均温度虚线

plt.plot([1, 15], [tem_low_ave, tem_low_ave], c=&#39;black&#39;, linestyle=&#39;--&#39;)# 画出平均温度虚线

plt.legend()

plt.text(tem_max_date+0.15, tem_max+0.15, str(tem_max), ha=&#39;center&#39;, va=&#39;bottom&#39;, fontsize=10.5)# 标出最高温度

plt.text(tem_min_date+0.15, tem_min+0.15, str(tem_min), ha=&#39;center&#39;, va=&#39;bottom&#39;, fontsize=10.5)# 标出最低温度

plt.xticks(x)

plt.title(&#39;未来14天高温低温变化曲线图&#39;)

plt.xlabel(&#39;未来天数/天&#39;)

plt.ylabel(&#39;摄氏度/℃&#39;)

plt.show()

def change_wind(wind):

"""改变风向"""

for i in range(0,14):

 if wind[i] == "北风":

wind[i] = 90

 elif wind[i] == "南风":

wind[i] = 270

 elif wind[i] == "西风":

wind[i] = 180

 elif wind[i] == "东风":

wind[i] = 360

 elif wind[i] == "东北风":

wind[i] = 45

 elif wind[i] == "西北风":

wind[i] = 135

 elif wind[i] == "西南风":

wind[i] = 225

 elif wind[i] == "东南风":

wind[i] = 315

return wind

def wind_radar(data):

"""风向雷达图"""

wind1 = list(data[&#39;风向1&#39;])

wind2 = list(data[&#39;风向2&#39;])

wind_speed = list(data[&#39;风级&#39;])

wind1 = change_wind(wind1)

wind2 = change_wind(wind2)


degs = np.arange(45,361,45)

temp = []

for deg in degs:

 speed = []

 # 获取 wind_deg 在指定范围的风速平均值数据

 for i in range(0,14):

if wind1[i] == deg:

 speed.append(wind_speed[i])

if wind2[i] == deg:

 speed.append(wind_speed[i])

 if len(speed) == 0:

temp.append(0)

 else:

temp.append(sum(speed)/len(speed))

print(temp)

N = 8

theta = np.arange(0.+np.pi/8,2*np.pi+np.pi/8,2*np.pi/8)

# 数据极径

radii = np.array(temp)

# 绘制极区图坐标系

plt.axes(polar=True)

# 定义每个扇区的RGB值(R,G,B),x越大,对应的颜色越接近蓝色

colors = [(1-x/max(temp), 1-x/max(temp),0.6) for x in radii]

plt.bar(theta,radii,width=(2*np.pi/N),bottom=0.0,color=colors)

plt.title(&#39;未来14天风级图&#39;,x=0.2,fontsize=20)

plt.show()

def weather_pie(data):

"""绘制天气饼图"""

weather = list(data[&#39;天气&#39;])

dic_wea = { }

for i in range(0,14):

 if weather[i] in dic_wea.keys():

dic_wea[weather[i]] += 1

 else:

dic_wea[weather[i]] = 1

print(dic_wea)

explode=[0.01]*len(dic_wea.keys())

color = [&#39;lightskyblue&#39;,&#39;silver&#39;,&#39;yellow&#39;,&#39;salmon&#39;,&#39;grey&#39;,&#39;lime&#39;,&#39;gold&#39;,&#39;red&#39;,&#39;green&#39;,&#39;pink&#39;]

plt.pie(dic_wea.values(),explode=explode,labels=dic_wea.keys(),autopct=&#39;%1.1f%%&#39;,colors=color)

plt.title(&#39;未来14天气候分布饼图&#39;)

plt.show()

def main():

plt.rcParams[&#39;font.sans-serif&#39;]=[&#39;SimHei&#39;] # 解决中文显示问题

plt.rcParams[&#39;axes.unicode_minus&#39;] = False# 解决负号显示问题

data14 = pd.read_csv(&#39;weather14.csv&#39;,encoding=&#39;gb2312&#39;)

print(data14)

tem_curve(data14)

wind_radar(data14)

weather_pie(data14)

if __name__ == &#39;__main__&#39;:

main()

登入後複製

以上是Python爬取天氣資料及視覺化分析的方法是什麼的詳細內容。更多資訊請關注PHP中文網其他相關文章!

本網站聲明
本文內容由網友自願投稿,版權歸原作者所有。本站不承擔相應的法律責任。如發現涉嫌抄襲或侵權的內容,請聯絡admin@php.cn

熱AI工具

Undresser.AI Undress

Undresser.AI Undress

人工智慧驅動的應用程序,用於創建逼真的裸體照片

AI Clothes Remover

AI Clothes Remover

用於從照片中去除衣服的線上人工智慧工具。

Undress AI Tool

Undress AI Tool

免費脫衣圖片

Clothoff.io

Clothoff.io

AI脫衣器

Video Face Swap

Video Face Swap

使用我們完全免費的人工智慧換臉工具,輕鬆在任何影片中換臉!

熱門文章

<🎜>:泡泡膠模擬器無窮大 - 如何獲取和使用皇家鑰匙
3 週前 By 尊渡假赌尊渡假赌尊渡假赌
北端:融合系統,解釋
3 週前 By 尊渡假赌尊渡假赌尊渡假赌
Mandragora:巫婆樹的耳語 - 如何解鎖抓鉤
3 週前 By 尊渡假赌尊渡假赌尊渡假赌

熱工具

記事本++7.3.1

記事本++7.3.1

好用且免費的程式碼編輯器

SublimeText3漢化版

SublimeText3漢化版

中文版,非常好用

禪工作室 13.0.1

禪工作室 13.0.1

強大的PHP整合開發環境

Dreamweaver CS6

Dreamweaver CS6

視覺化網頁開發工具

SublimeText3 Mac版

SublimeText3 Mac版

神級程式碼編輯軟體(SublimeText3)

熱門話題

Java教學
1666
14
CakePHP 教程
1425
52
Laravel 教程
1327
25
PHP教程
1273
29
C# 教程
1253
24
PHP和Python:解釋了不同的範例 PHP和Python:解釋了不同的範例 Apr 18, 2025 am 12:26 AM

PHP主要是過程式編程,但也支持面向對象編程(OOP);Python支持多種範式,包括OOP、函數式和過程式編程。 PHP適合web開發,Python適用於多種應用,如數據分析和機器學習。

在PHP和Python之間進行選擇:指南 在PHP和Python之間進行選擇:指南 Apr 18, 2025 am 12:24 AM

PHP適合網頁開發和快速原型開發,Python適用於數據科學和機器學習。 1.PHP用於動態網頁開發,語法簡單,適合快速開發。 2.Python語法簡潔,適用於多領域,庫生態系統強大。

sublime怎麼運行代碼python sublime怎麼運行代碼python Apr 16, 2025 am 08:48 AM

在 Sublime Text 中運行 Python 代碼,需先安裝 Python 插件,再創建 .py 文件並編寫代碼,最後按 Ctrl B 運行代碼,輸出會在控制台中顯示。

PHP和Python:深入了解他們的歷史 PHP和Python:深入了解他們的歷史 Apr 18, 2025 am 12:25 AM

PHP起源於1994年,由RasmusLerdorf開發,最初用於跟踪網站訪問者,逐漸演變為服務器端腳本語言,廣泛應用於網頁開發。 Python由GuidovanRossum於1980年代末開發,1991年首次發布,強調代碼可讀性和簡潔性,適用於科學計算、數據分析等領域。

Python vs. JavaScript:學習曲線和易用性 Python vs. JavaScript:學習曲線和易用性 Apr 16, 2025 am 12:12 AM

Python更適合初學者,學習曲線平緩,語法簡潔;JavaScript適合前端開發,學習曲線較陡,語法靈活。 1.Python語法直觀,適用於數據科學和後端開發。 2.JavaScript靈活,廣泛用於前端和服務器端編程。

Golang vs. Python:性能和可伸縮性 Golang vs. Python:性能和可伸縮性 Apr 19, 2025 am 12:18 AM

Golang在性能和可擴展性方面優於Python。 1)Golang的編譯型特性和高效並發模型使其在高並發場景下表現出色。 2)Python作為解釋型語言,執行速度較慢,但通過工具如Cython可優化性能。

vscode在哪寫代碼 vscode在哪寫代碼 Apr 15, 2025 pm 09:54 PM

在 Visual Studio Code(VSCode)中編寫代碼簡單易行,只需安裝 VSCode、創建項目、選擇語言、創建文件、編寫代碼、保存並運行即可。 VSCode 的優點包括跨平台、免費開源、強大功能、擴展豐富,以及輕量快速。

notepad 怎麼運行python notepad 怎麼運行python Apr 16, 2025 pm 07:33 PM

在 Notepad 中運行 Python 代碼需要安裝 Python 可執行文件和 NppExec 插件。安裝 Python 並為其添加 PATH 後,在 NppExec 插件中配置命令為“python”、參數為“{CURRENT_DIRECTORY}{FILE_NAME}”,即可在 Notepad 中通過快捷鍵“F6”運行 Python 代碼。

See all articles