

利用 Python 實現點雲的地面檢測

1. 電腦視覺座標系統
在開始之前,了解電腦視覺中的傳統座標係是很重要的。其次是Open3D和Microsoft Kinect感測器。在電腦視覺中,影像以獨立的2D座標系表示,其中x軸從左向右指向,y軸是上下指向。對於相機,3D座標係原點位於相機的焦點處,x軸指向右,y軸指向下,z軸指向前。
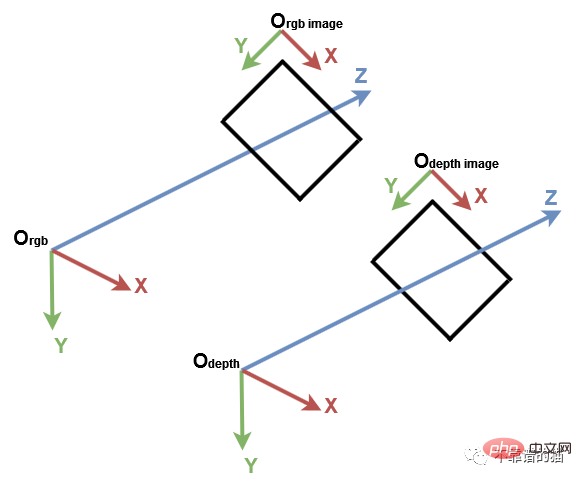
電腦視覺座標系
我們先匯入所需的Python函式庫:
import numpy as np
import open3d as o3d
為了更好地理解,讓我們從PLY 檔案中匯入點雲,使用Open3D 建立預設的3D 座標系並顯示它們:
# Read point cloud:
pcd = o3d.io.read_point_cloud("data/depth_2_pcd.ply")
# Create a 3D coordinate system:
origin = o3d.geometry.TriangleMesh.create_coordinate_frame(size=0.5)
# geometries to draw:
geometries = [pcd, origin]
# Visualize:
o3d.visualization.draw_geometries(geometries)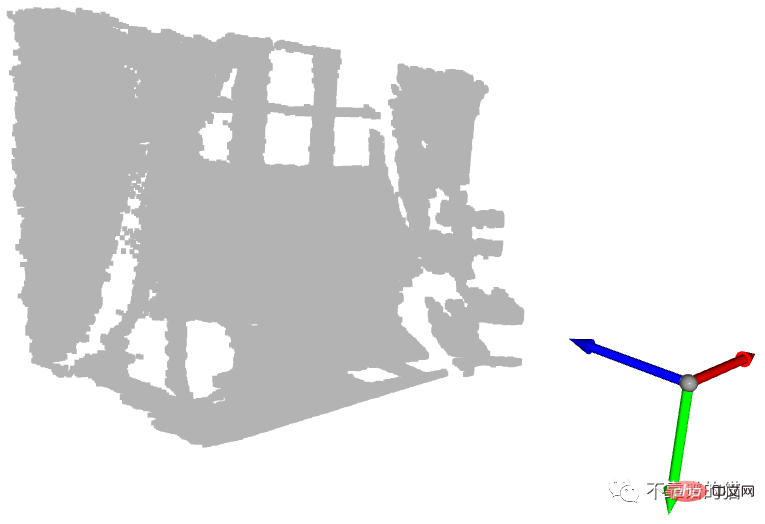
# Get max and min points of each axis x, y and z:
x_max = max(pcd.points, key=lambda x: x[0])
y_max = max(pcd.points, key=lambda x: x[1])
z_max = max(pcd.points, key=lambda x: x[2])
x_min = min(pcd.points, key=lambda x: x[0])
y_min = min(pcd.points, key=lambda x: x[1])
z_min = min(pcd.points, key=lambda x: x[2])
# Colors:
RED = [1., 0., 0.]
GREEN = [0., 1., 0.]
BLUE = [0., 0., 1.]
YELLOW = [1., 1., 0.]
MAGENTA = [1., 0., 1.]
CYAN = [0., 1., 1.]


positions = [x_max, y_max, z_max, x_min, y_min, z_min]
colors = [RED, GREEN, BLUE, MAGENTA, YELLOW, CYAN]
for i in range(len(positions)):
 # Create a sphere mesh:
 sphere = o3d.geometry.TriangleMesh.create_sphere(radius=0.05)
 # move to the point position:
 sphere.translate(np.asarray(positions[i]))
 # add color:
 sphere.paint_uniform_color(np.asarray(colors[i]))
 # compute normals for vertices or faces:
 sphere.compute_vertex_normals()
 # add to geometry list to display later:
 geometries.append(sphere)


# Display:
o3d.visualization.draw_geometries(geometries)
# Define a threshold:
THRESHOLD = 0.075


# Get the max value along the y-axis:
y_max = max(pcd.points, key=lambda x: x[1])[1]


# Get the original points color to be updated:
pcd_colors = np.asarray(pcd.colors)


# Number of points:
n_points = pcd_colors.shape[0]


# update color:
for i in range(n_points):
# if the current point is aground point:
if pcd.points[i][1] >= y_max - THRESHOLD:
pcd_colors[i] = GREEN# color it green


pcd.colors = o3d.utility.Vector3dVector(pcd_colors)


# Display:
o3d.visualization.draw_geometries([pcd, origin])
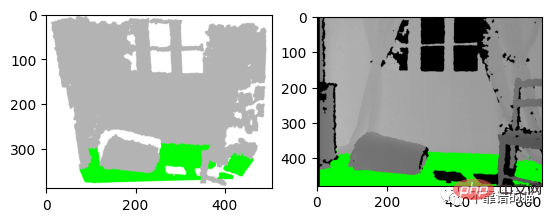
左:3D 可视化的屏幕截图 右:深度图像的结果
让我们从之前的深度图像创建一个有组织的点云。我们首先导入相机参数。我们还导入深度图像并将其转换为3通道灰度图像,以便我们可以将地面像素设置为绿色:
import imageio.v3 as iio
import numpy as np
import matplotlib.pyplot as plt


# Camera parameters:
FX_DEPTH = 5.8262448167737955e+02
FY_DEPTH = 5.8269103270988637e+02
CX_DEPTH = 3.1304475870804731e+02
CY_DEPTH = 2.3844389626620386e+02


# Read depth image:
depth_image = iio.imread('../data/depth_2.png')
# Compute the grayscale image:
depth_grayscale = np.array(256 * depth_image / 0x0fff, dtype=np.uint8)
# Convert a grayscale image to a 3-channel image:
depth_grayscale = np.stack((depth_grayscale,) * 3, axis=-1)要计算一个有组织的点云,我们使用与上一篇教程相同的方法(Python:基于 RGB-D 图像的点云计算)。我们没有将深度图像扁平化,而是将jj和ii重塑为与深度图像相同的形状,如下所示:
# get depth image resolution:
height, width = depth_image.shape
# compute indices and reshape it to have the same shape as the depth image:
jj = np.tile(range(width), height).reshape((height, width))
ii = np.repeat(range(height), width).reshape((height, width))
# Compute constants:
xx = (jj - CX_DEPTH) / FX_DEPTH
yy = (ii - CY_DEPTH) / FY_DEPTH
# compute organised point cloud:
organized_pcd = np.dstack((xx * depth_image, yy * depth_image, depth_image))
如果你打印出创建的点云的形状,你可以看到它是一个有3个通道的矩阵(480,640,3)。如果你觉得这个代码很难理解,请回到之前的教程(Python:基于 RGB-D 图像的点云计算)。
类似地,我们像上面那样检测地面,但不是更新点的颜色并显示点云,而是更新灰度图像的像素并显示它:
# Ground_detection:
THRESHOLD = 0.075 * 1000# Define a threshold
y_max = max(organized_pcd.reshape((height * width, 3)), key=lambda x: x[1])[
1]# Get the max value along the y-axis


# Set the ground pixels to green:
for i in range(height):
for j in range(width):
if organized_pcd[i][j][1] >= y_max - THRESHOLD:
depth_grayscale[i][j] = [0, 255, 0]# Update the depth image


# Display depth_grayscale:
plt.imshow(depth_grayscale)
plt.show()
4.结论
在本教程中,为了熟悉点云,我们引入了默认坐标系统,并实现了一个简单的地面检测算法。事实上,地面检测在某些应用(如导航)中是一项重要的任务,文献中已经提出了几种算法。实现算法简单;它认为最低点是地面。然而,它的限制是,深度相机必须与地面平行,这是大多数现实应用的情况不是这样的。
以上是利用 Python 實現點雲的地面檢測的詳細內容。更多資訊請關注PHP中文網其他相關文章!

熱AI工具

Undresser.AI Undress
人工智慧驅動的應用程序,用於創建逼真的裸體照片

AI Clothes Remover
用於從照片中去除衣服的線上人工智慧工具。

Undress AI Tool
免費脫衣圖片

Clothoff.io
AI脫衣器

Video Face Swap
使用我們完全免費的人工智慧換臉工具,輕鬆在任何影片中換臉!

熱門文章
熱工具

記事本++7.3.1
好用且免費的程式碼編輯器

SublimeText3漢化版
中文版,非常好用

禪工作室 13.0.1
強大的PHP整合開發環境

Dreamweaver CS6
視覺化網頁開發工具

SublimeText3 Mac版
神級程式碼編輯軟體(SublimeText3)


 PHP和Python:解釋了不同的範例
Apr 18, 2025 am 12:26 AM
PHP和Python:解釋了不同的範例
Apr 18, 2025 am 12:26 AM
PHP主要是過程式編程,但也支持面向對象編程(OOP);Python支持多種範式,包括OOP、函數式和過程式編程。 PHP適合web開發,Python適用於多種應用,如數據分析和機器學習。
 在PHP和Python之間進行選擇:指南
Apr 18, 2025 am 12:24 AM
在PHP和Python之間進行選擇:指南
Apr 18, 2025 am 12:24 AM
PHP適合網頁開發和快速原型開發,Python適用於數據科學和機器學習。 1.PHP用於動態網頁開發,語法簡單,適合快速開發。 2.Python語法簡潔,適用於多領域,庫生態系統強大。
 sublime怎麼運行代碼python
Apr 16, 2025 am 08:48 AM
sublime怎麼運行代碼python
Apr 16, 2025 am 08:48 AM
在 Sublime Text 中運行 Python 代碼,需先安裝 Python 插件,再創建 .py 文件並編寫代碼,最後按 Ctrl B 運行代碼,輸出會在控制台中顯示。
 Python vs. JavaScript:學習曲線和易用性
Apr 16, 2025 am 12:12 AM
Python vs. JavaScript:學習曲線和易用性
Apr 16, 2025 am 12:12 AM
Python更適合初學者,學習曲線平緩,語法簡潔;JavaScript適合前端開發,學習曲線較陡,語法靈活。 1.Python語法直觀,適用於數據科學和後端開發。 2.JavaScript靈活,廣泛用於前端和服務器端編程。
 PHP和Python:深入了解他們的歷史
Apr 18, 2025 am 12:25 AM
PHP和Python:深入了解他們的歷史
Apr 18, 2025 am 12:25 AM
PHP起源於1994年,由RasmusLerdorf開發,最初用於跟踪網站訪問者,逐漸演變為服務器端腳本語言,廣泛應用於網頁開發。 Python由GuidovanRossum於1980年代末開發,1991年首次發布,強調代碼可讀性和簡潔性,適用於科學計算、數據分析等領域。
 Golang vs. Python:性能和可伸縮性
Apr 19, 2025 am 12:18 AM
Golang vs. Python:性能和可伸縮性
Apr 19, 2025 am 12:18 AM
Golang在性能和可擴展性方面優於Python。 1)Golang的編譯型特性和高效並發模型使其在高並發場景下表現出色。 2)Python作為解釋型語言,執行速度較慢,但通過工具如Cython可優化性能。
 vscode在哪寫代碼
Apr 15, 2025 pm 09:54 PM
vscode在哪寫代碼
Apr 15, 2025 pm 09:54 PM
在 Visual Studio Code(VSCode)中編寫代碼簡單易行,只需安裝 VSCode、創建項目、選擇語言、創建文件、編寫代碼、保存並運行即可。 VSCode 的優點包括跨平台、免費開源、強大功能、擴展豐富,以及輕量快速。
 notepad 怎麼運行python
Apr 16, 2025 pm 07:33 PM
notepad 怎麼運行python
Apr 16, 2025 pm 07:33 PM
在 Notepad 中運行 Python 代碼需要安裝 Python 可執行文件和 NppExec 插件。安裝 Python 並為其添加 PATH 後,在 NppExec 插件中配置命令為“python”、參數為“{CURRENT_DIRECTORY}{FILE_NAME}”,即可在 Notepad 中通過快捷鍵“F6”運行 Python 代碼。
