

Spring Boot怎麼自訂監控指標

1.建立專案
pom.xml引入相關依賴
<project xmlns="http://maven.apache.org/POM/4.0.0" xmlns:xsi="http://www.w3.org/2001/XMLSchema-instance" xsi:schemaLocation="http://maven.apache.org/POM/4.0.0 https://maven.apache.org/xsd/maven-4.0.0.xsd">
	<modelVersion>4.0.0</modelVersion>
	<groupId>com.olive</groupId>
	<artifactId>prometheus-meter-demo</artifactId>
	<version>0.0.1-SNAPSHOT</version>
	<parent>
		<groupId>org.springframework.boot</groupId>
		<artifactId>spring-boot-starter-parent</artifactId>
		<version>2.3.7.RELEASE</version>
		<relativePath />
	</parent>
	<properties>
		<java.version>1.8</java.version>
		<project.build.sourceEncoding>UTF-8</project.build.sourceEncoding>
		<project.reporting.outputEncoding>UTF-8</project.reporting.outputEncoding>
		<spring-boot.version>2.3.7.RELEASE</spring-boot.version>
	</properties>
	<dependencies>
		<dependency>
			<groupId>org.springframework.boot</groupId>
			<artifactId>spring-boot-starter-aop</artifactId>
		</dependency>
		<dependency>
			<groupId>org.springframework.boot</groupId>
			<artifactId>spring-boot-starter-web</artifactId>
		</dependency>
		<dependency>
			<groupId>org.springframework.boot</groupId>
			<artifactId>spring-boot-starter-actuator</artifactId>
		</dependency>
		<!-- Micrometer Prometheus registry  -->
		<dependency>
			<groupId>io.micrometer</groupId>
			<artifactId>micrometer-registry-prometheus</artifactId>
		</dependency>
	</dependencies>
	<dependencyManagement>
		<dependencies>
			<dependency>
				<groupId>org.springframework.boot</groupId>
				<artifactId>spring-boot-dependencies</artifactId>
				<version>${spring-boot.version}</version>
				<type>pom</type>
				<scope>import</scope>
			</dependency>
		</dependencies>
	</dependencyManagement>
</project>2.自訂指標
方式一
直接使用micrometer核心套件的類別進行指標定義和註冊
package com.olive.monitor;

import javax.annotation.PostConstruct;

import org.springframework.beans.factory.annotation.Autowired;
import org.springframework.stereotype.Component;

import io.micrometer.core.instrument.Counter;
import io.micrometer.core.instrument.DistributionSummary;
import io.micrometer.core.instrument.MeterRegistry;

@Component
public class NativeMetricsMontior {

	/**
	 * 支付次数
	 */
	private Counter payCount;

	/**
	 * 支付金额统计
	 */
	private DistributionSummary payAmountSum;

	@Autowired
	private MeterRegistry registry;

	@PostConstruct
	private void init() {
		payCount = registry.counter("pay_request_count", "payCount", "pay-count");
		payAmountSum = registry.summary("pay_amount_sum", "payAmountSum", "pay-amount-sum");
	}

	public Counter getPayCount() {
		return payCount;
	}

	public DistributionSummary getPayAmountSum() {
		return payAmountSum;
	}

}方式二
透過引入micrometer-registry-prometheus 包,該包結合prometheus,對micrometer進行了封裝
<dependency>
			<groupId>io.micrometer</groupId>
			<artifactId>micrometer-registry-prometheus</artifactId>
		</dependency>
同樣定義兩個metrics
package com.olive.monitor;

import javax.annotation.PostConstruct;

import org.springframework.beans.factory.annotation.Autowired;
import org.springframework.stereotype.Component;

import io.prometheus.client.CollectorRegistry;
import io.prometheus.client.Counter;

@Component
public class PrometheusMetricsMonitor {

	/**
	 * 订单发起次数
	 */
	private Counter orderCount;

	/**
	 * 金额统计
	 */
	private Counter orderAmountSum;

	@Autowired
	private CollectorRegistry registry;
	@PostConstruct
	private void init() {
		orderCount = Counter.build().name("order_request_count")
				.help("order request count.")
				.labelNames("orderCount")
				.register();
		orderAmountSum = Counter.build().name("order_amount_sum")
				.help("order amount sum.")
				.labelNames("orderAmountSum")
				.register();
		registry.register(orderCount);
		registry.register(orderAmountSum);
	}

	public Counter getOrderCount() {
		return orderCount;
	}

	public Counter getOrderAmountSum() {
		return orderAmountSum;
	}

}prometheus 4種常用Metrics
Counter
#連續增加不會減少的計數器,可以用來記錄只增不減的類型,例如:網站訪問人數,系統運行時間等。
對於Counter類型的指標,只包含一個inc()的方法,就是用於計數器1.
一般而言,Counter類型的metric指標在冥冥中我們使用_total結束,如http_requests_total.
Gauge
可增可減的儀錶板,曲線圖
對於這類可增可減的指標,用於反應應用的當前狀態。
例如在監控主機時,主機目前空閒的記憶體大小,可用記憶體大小等等。
對於Gauge指標的物件則包含兩個主要的方法inc()和dec(),用於增加和減少計數。
Histogram
主要用來統計資料的分佈情況,這是一種特殊的metrics資料類型,代表的是一種近似的百分比估算數值,統計所有離散的指標資料在各個取值區段內的次數。例如:我們想統計一段時間內http請求回應小於0.005秒、小於0.01秒、小於0.025秒的資料分佈情況。那麼使用Histogram採集每一次http請求的時間,同時設定bucket。
Summary
Summary和Histogram非常相似,都可以統計事件發生的次數或大小,以及其分佈情況,他們都提供了對時間的計數_count以及值的總和_sum ,也都提供了可以計算統計樣本分佈情況的功能,不同之處在於Histogram可以透過histogram_quantile函數在伺服器計算分位數。而Sumamry的分位數則是直接在客戶端定義的。因此對於分位數的計算,Summary在透過PromQL進行查詢的時候有更好的效能表現,而Histogram則會消耗更多的資源,但是相對於客戶端而言Histogram消耗的資源就更少。用哪個都行,依照實際場景自由調整即可。
3. 測試
定義兩個controller分別使用NativeMetricsMontior和PrometheusMetricsMonitor
package com.olive.controller;

import java.util.Random;

import javax.annotation.Resource;

import org.springframework.web.bind.annotation.RequestMapping;
import org.springframework.web.bind.annotation.RequestParam;
import org.springframework.web.bind.annotation.RestController;

import com.olive.monitor.NativeMetricsMontior;

@RestController
public class PayController {

	@Resource
	private NativeMetricsMontior monitor;

	@RequestMapping("/pay")
	public String pay(@RequestParam("amount") Double amount) throws Exception {
		// 统计支付次数
		monitor.getPayCount().increment();

		Random random = new Random();
		//int amount = random.nextInt(100);
		if(amount==null) {
			amount = 0.0;
		}
		// 统计支付总金额
		monitor.getPayAmountSum().record(amount);
		return "支付成功, 支付金额: " + amount;
	}

}
package com.olive.controller;

import java.util.Random;

import javax.annotation.Resource;

import org.springframework.web.bind.annotation.RequestMapping;
import org.springframework.web.bind.annotation.RequestParam;
import org.springframework.web.bind.annotation.RestController;

import com.olive.monitor.PrometheusMetricsMonitor;

@RestController
public class OrderController {

	@Resource
	private PrometheusMetricsMonitor monitor;

	@RequestMapping("/order")
	public String order(@RequestParam("amount") Double amount) throws Exception {
		// 订单总数
		monitor.getOrderCount()
			.labels("orderCount")
			.inc();

		Random random = new Random();
		//int amount = random.nextInt(100);
		if(amount==null) {
			amount = 0.0;
		}
		// 统计订单总金额
		monitor.getOrderAmountSum()
			.labels("orderAmountSum")
			.inc(amount);
		return "下单成功, 订单金额: " + amount;
	}

}啟動服務
#訪問http://127.0.0.1:9595/actuator/prometheus;正常看到監測資料

http://127.0.0.1:8080/order?amount=100和http://127.0.0.1:8080/pay?amount=10後;再造訪#http:/ /127.0.0.1:9595/actuator/prometheus。查看監控資料

Aspect;這樣的方式就非常友善。能在入口就做了資料埋點監測,無須在controller裡進行程式碼編寫。
package com.olive.aspect;

import java.time.LocalDate;
import java.util.concurrent.TimeUnit;

import javax.servlet.http.HttpServletRequest;

import org.aspectj.lang.ProceedingJoinPoint;
import org.aspectj.lang.annotation.Around;
import org.aspectj.lang.annotation.Aspect;
import org.aspectj.lang.annotation.Pointcut;
import org.springframework.stereotype.Component;
import org.springframework.util.StringUtils;
import org.springframework.web.context.request.RequestContextHolder;
import org.springframework.web.context.request.ServletRequestAttributes;

import io.micrometer.core.instrument.Metrics;

@Aspect
@Component
public class PrometheusMetricsAspect {

    // 切入所有controller包下的请求方法
    @Pointcut("execution(* com.olive.controller..*.*(..))")
    public void controllerPointcut() {
    }

    @Around("controllerPointcut()")
    public Object MetricsCollector(ProceedingJoinPoint joinPoint) throws Throwable {

        HttpServletRequest request = ((ServletRequestAttributes) RequestContextHolder.getRequestAttributes()).getRequest();
        String userId = StringUtils.hasText(request.getParameter("userId")) ?
        		request.getParameter("userId") : "no userId";

        // 获取api url
        String api = request.getServletPath();
        // 获取请求方法
        String method = request.getMethod();
        long startTs = System.currentTimeMillis();
        LocalDate now = LocalDate.now();
        String[] tags = new String[10];
        tags[0] = "api";
        tags[1] = api;
        tags[2] = "method";
        tags[3] = method;
        tags[4] = "day";
        tags[5] = now.toString();
        tags[6] = "userId";
        tags[7] = userId;

        String amount = StringUtils.hasText(request.getParameter("amount")) ?
        		request.getParameter("amount") : "0.0";

        tags[8] = "amount";
        tags[9] = amount;
        // 请求次数加1
        //自定义的指标名称:custom_http_request_all,指标包含数据
        Metrics.counter("custom_http_request_all", tags).increment();
        Object object = null;
        try {
            object = joinPoint.proceed();
        } catch (Exception e) {
            //请求失败次数加1
            Metrics.counter("custom_http_request_error", tags).increment();
            throw e;
        } finally {
            long endTs = System.currentTimeMillis() - startTs;
            //记录请求响应时间
           Metrics.timer("custom_http_request_time", tags).record(endTs, TimeUnit.MILLISECONDS);
        }
        return object;
    }
}
以上是Spring Boot怎麼自訂監控指標的詳細內容。更多資訊請關注PHP中文網其他相關文章!

熱AI工具

Undresser.AI Undress
人工智慧驅動的應用程序,用於創建逼真的裸體照片

AI Clothes Remover
用於從照片中去除衣服的線上人工智慧工具。

Undress AI Tool
免費脫衣圖片

Clothoff.io
AI脫衣器

Video Face Swap
使用我們完全免費的人工智慧換臉工具,輕鬆在任何影片中換臉!

熱門文章
熱工具

記事本++7.3.1
好用且免費的程式碼編輯器

SublimeText3漢化版
中文版,非常好用

禪工作室 13.0.1
強大的PHP整合開發環境

Dreamweaver CS6
視覺化網頁開發工具

SublimeText3 Mac版
神級程式碼編輯軟體(SublimeText3)


 Springboot怎麼整合Jasypt實現設定檔加密
Jun 01, 2023 am 08:55 AM
Springboot怎麼整合Jasypt實現設定檔加密
Jun 01, 2023 am 08:55 AM
Jasypt介紹Jasypt是一個java庫,它允許開發員以最少的努力為他/她的專案添加基本的加密功能,並且不需要對加密工作原理有深入的了解用於單向和雙向加密的高安全性、基於標準的加密技術。加密密碼,文本,數字,二進位檔案...適合整合到基於Spring的應用程式中,開放API,用於任何JCE提供者...添加如下依賴:com.github.ulisesbocchiojasypt-spring-boot-starter2. 1.1Jasypt好處保護我們的系統安全,即使程式碼洩露,也可以保證資料來源的
 怎麼在SpringBoot中使用Redis實現分散式鎖
Jun 03, 2023 am 08:16 AM
怎麼在SpringBoot中使用Redis實現分散式鎖
Jun 03, 2023 am 08:16 AM
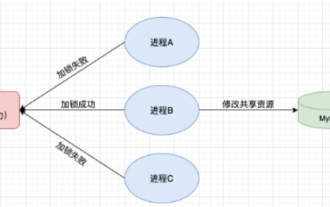
一、Redis實現分散式鎖原理為什麼需要分散式鎖在聊分散式鎖之前,有必要先解釋一下,為什麼需要分散式鎖。與分散式鎖相對就的是單機鎖,我們在寫多執行緒程式時,避免同時操作一個共享變數產生資料問題,通常會使用一把鎖來互斥以保證共享變數的正確性,其使用範圍是在同一個進程中。如果換做是多個進程,需要同時操作一個共享資源,如何互斥?現在的業務應用通常是微服務架構,這也意味著一個應用會部署多個進程,多個進程如果需要修改MySQL中的同一行記錄,為了避免操作亂序導致髒數據,此時就需要引入分佈式鎖了。想要實現分
 SpringBoot怎麼整合Redisson實現延遲隊列
May 30, 2023 pm 02:40 PM
SpringBoot怎麼整合Redisson實現延遲隊列
May 30, 2023 pm 02:40 PM
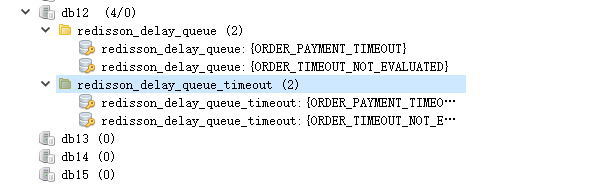
使用場景1、下單成功,30分鐘未支付。支付超時,自動取消訂單2、訂單簽收,簽收後7天未進行評估。訂單超時未評價,系統預設好評3、下單成功,商家5分鐘未接單,訂單取消4、配送超時,推播簡訊提醒…對於延時比較長的場景、即時性不高的場景,我們可以採用任務調度的方式定時輪詢處理。如:xxl-job今天我們採
 springboot讀取檔案打成jar包後存取不到怎麼解決
Jun 03, 2023 pm 04:38 PM
springboot讀取檔案打成jar包後存取不到怎麼解決
Jun 03, 2023 pm 04:38 PM
springboot讀取文件,打成jar包後訪問不到最新開發出現一種情況,springboot打成jar包後讀取不到文件,原因是打包之後,文件的虛擬路徑是無效的,只能通過流去讀取。文件在resources下publicvoidtest(){Listnames=newArrayList();InputStreamReaderread=null;try{ClassPathResourceresource=newClassPathResource("name.txt");Input
 Springboot+Mybatis-plus不使用SQL語句進行多表新增怎麼實現
Jun 02, 2023 am 11:07 AM
Springboot+Mybatis-plus不使用SQL語句進行多表新增怎麼實現
Jun 02, 2023 am 11:07 AM
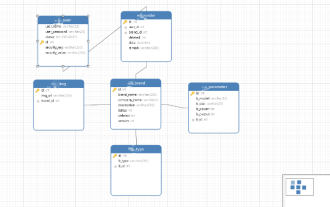
在Springboot+Mybatis-plus不使用SQL語句進行多表添加操作我所遇到的問題準備工作在測試環境下模擬思維分解一下:創建出一個帶有參數的BrandDTO對像模擬對後台傳遞參數我所遇到的問題我們都知道,在我們使用Mybatis-plus中進行多表操作是極其困難的,如果你不使用Mybatis-plus-join這一類的工具,你只能去配置對應的Mapper.xml文件,配置又臭又長的ResultMap,然後再寫對應的sql語句,這種方法雖然看上去很麻煩,但具有很高的靈活性,可以讓我們
 SpringBoot怎麼自訂Redis實作快取序列化
Jun 03, 2023 am 11:32 AM
SpringBoot怎麼自訂Redis實作快取序列化
Jun 03, 2023 am 11:32 AM
1.自訂RedisTemplate1.1、RedisAPI預設序列化機制基於API的Redis快取實作是使用RedisTemplate範本進行資料快取操作的,這裡開啟RedisTemplate類,查看該類別的源碼資訊publicclassRedisTemplateextendsRedisAccessorimplementsRedisOperations,BeanClassLoaderAware{//聲明了value的各種序列化方式,初始值為空@NullableprivateRedisSe
 SpringBoot與SpringMVC的比較及差別分析
Dec 29, 2023 am 11:02 AM
SpringBoot與SpringMVC的比較及差別分析
Dec 29, 2023 am 11:02 AM
SpringBoot和SpringMVC都是Java開發中常用的框架,但它們之間有一些明顯的差異。本文將探究這兩個框架的特點和用途,並對它們的差異進行比較。首先,我們來了解一下SpringBoot。 SpringBoot是由Pivotal團隊開發的,它旨在簡化基於Spring框架的應用程式的建立和部署。它提供了一種快速、輕量級的方式來建立獨立的、可執行
 springboot怎麼取得application.yml裡值
Jun 03, 2023 pm 06:43 PM
springboot怎麼取得application.yml裡值
Jun 03, 2023 pm 06:43 PM
在專案中,很多時候需要用到一些配置信息,這些信息在測試環境和生產環境下可能會有不同的配置,後面根據實際業務情況有可能還需要再做修改。我們不能將這些設定在程式碼中寫死,最好是寫到設定檔中,例如可以把這些資訊寫到application.yml檔案中。那麼,怎麼在程式碼裡取得或使用這個位址呢?有2個方法。方法一:我們可以透過@Value註解的${key}即可取得設定檔(application.yml)中和key對應的value值,這個方法適用於微服務比較少的情形方法二:在實際專案中,遇到業務繁瑣,邏
