

Python如何建構一個決策樹

決策樹
決策樹是當今最強大的監督學習方法的組成部分。決策樹基本上是二元樹的流程圖,其中每個節點根據某個特徵變數將一組觀測值拆分。
決策樹的目標是將資料分成多個群組,這樣一個群組中的每個元素都屬於同一個類別。決策樹也可以用來近似連續的目標變數。在這種情況下,樹將進行拆分,使每個組的均方誤差最小。
決策樹的一個重要特徵是它們很容易被解釋。你根本不需要熟悉機器學習技術就可以理解決策樹在做什麼。決策樹圖很容易解釋。
利弊
決策樹方法的優點是:
決策樹能夠產生可理解的規則。
決策樹在不需要大量計算的情況下進行分類。
決策樹能夠處理連續變數和分類變數。
決策樹提供了一個明確的指示,哪些欄位是最重要的。
決策樹方法的缺點是:
#決策樹不太適合目標是預測連續屬性值的估計任務。
決策樹在類別多、訓練樣本少的分類問題中容易出錯。
決策樹的訓練在計算上可能很昂貴。產生決策樹的過程在計算上非常昂貴。在每個節點上,每個候選拆分欄位都必須排序,才能找到其最佳拆分。在某些演算法中,使用字段組合,必須搜尋最佳組合權重。剪枝演算法也可能是昂貴的,因為許多候選子樹必須形成和比較。
Python決策樹
Python是一種通用程式語言,它為資料科學家提供了強大的機器學習套件和工具。在本文中,我們將使用python最著名的機器學習套件scikit-learn來建立決策樹模型。我們將使用scikit learn提供的「DecisionTreeClassifier」演算法建立模型,然後使用「plot_tree」函數來視覺化模型。
步驟1:導入套件
我們建構模型的主要軟體包是pandas、scikit learn和NumPy。依照程式碼在python中導入所需的套件。
import pandas as pd # 数据处理 import numpy as np # 使用数组 import matplotlib.pyplot as plt # 可视化 from matplotlib import rcParams # 图大小 from termcolor import colored as cl # 文本自定义 from sklearn.tree import DecisionTreeClassifier as dtc # 树算法 from sklearn.model_selection import train_test_split # 拆分数据 from sklearn.metrics import accuracy_score # 模型准确度 from sklearn.tree import plot_tree # 树图 rcParams['figure.figsize'] = (25, 20)
在導入建立我們的模型所需的所有套件之後,是時候導入資料並對其進行一些EDA了。
步驟2:導入資料和EDA
在這一步驟中,我們將使用python中提供的「Pandas」套件來導入並在其上進行一些EDA 。我們將建立我們的決策樹模型,資料集是一個藥物資料集,它是基於特定的標準給病人的處方。讓我們用python導入資料!
Python實作:
df = pd.read_csv('drug.csv') df.drop('Unnamed: 0', axis = 1, inplace = True) print(cl(df.head(), attrs = ['bold']))輸出:
Age Sex BP Cholesterol Na_to_K Drug 0 23 F HIGH HIGH 25.355 drugY 1 47 M LOW HIGH 13.093 drugC 2 47 M LOW HIGH 10.114 drugC 3 28 F NORMAL HIGH 7.798 drugX 4 61 F LOW HIGH 18.043 drugY
現在我們對資料集有了一個清晰的概念。導入資料後,讓我們使用“info”函數來獲取有關資料的一些基本資訊。此函數提供的資訊包括條目數、索引號、列名、非空值計數、屬性類型等。
Python實作:
df.info()
輸出:
<class> RangeIndex: 200 entries, 0 to 199 Data columns (total 6 columns): # Column Non-Null Count Dtype --- ------ -------------- ----- 0 Age 200 non-null int64 1 Sex 200 non-null object 2 BP 200 non-null object 3 Cholesterol 200 non-null object 4 Na_to_K 200 non-null float64 5 Drug 200 non-null object dtypes: float64(1), int64(1), object(4) memory usage: 9.5+ KB</class>
步驟3:資料處理
我們可以看到像Sex, BP和Cholesterol這樣的屬性在本質上是分類的和物件類型的。問題是,scikit-learn中的決策樹演算法本質上不支援X變數(特徵)是「物件」類型。因此,有必要將這些“object”值轉換為“binary”值。讓我們用python來實作
Python實作:
for i in df.Sex.values: if i == 'M': df.Sex.replace(i, 0, inplace = True) else: df.Sex.replace(i, 1, inplace = True) for i in df.BP.values: if i == 'LOW': df.BP.replace(i, 0, inplace = True) elif i == 'NORMAL': df.BP.replace(i, 1, inplace = True) elif i == 'HIGH': df.BP.replace(i, 2, inplace = True) for i in df.Cholesterol.values: if i == 'LOW': df.Cholesterol.replace(i, 0, inplace = True) else: df.Cholesterol.replace(i, 1, inplace = True) print(cl(df, attrs = ['bold']))
輸出:
Age Sex BP Cholesterol Na_to_K Drug 0 23 1 2 1 25.355 drugY 1 47 1 0 1 13.093 drugC 2 47 1 0 1 10.114 drugC 3 28 1 1 1 7.798 drugX 4 61 1 0 1 18.043 drugY .. ... ... .. ... ... ... 195 56 1 0 1 11.567 drugC 196 16 1 0 1 12.006 drugC 197 52 1 1 1 9.894 drugX 198 23 1 1 1 14.020 drugX 199 40 1 0 1 11.349 drugX [200 rows x 6 columns]
我們可以觀察到所有的「object」值都被處理成“binary”值來表示分類資料。例如,在膽固醇屬性中,顯示「低」的值被處理為0,「高」則被處理為1。現在我們準備好從資料中建立因變數和自變數。
步驟4:拆分資料
在將我們的資料處理為正確的結構之後,我們現在設定「X」變數(自變數),「Y ”變數(因變數)。讓我們用python來實現
Python實作:
X_var = df[['Sex', 'BP', 'Age', 'Cholesterol', 'Na_to_K']].values # 自变量 y_var = df['Drug'].values # 因变量 print(cl('X variable samples : {}'.format(X_var[:5]), attrs = ['bold'])) print(cl('Y variable samples : {}'.format(y_var[:5]), attrs = ['bold']))輸出:
X variable samples : [[ 1. 2. 23. 1. 25.355] [ 1. 0. 47. 1. 13.093] [ 1. 0. 47. 1. 10.114] [ 1. 1. 28. 1. 7.798] [ 1. 0. 61. 1. 18.043]] Y variable samples : ['drugY' 'drugC' 'drugC' 'drugX' 'drugY']
我們現在可以使用scikit learn中的「train_test_split」演算法將資料分成訓練集和測試集,其中包含我們定義的X和Y變數。依照程式碼在python中拆分資料。
Python實作:
X_train, X_test, y_train, y_test = train_test_split(X_var, y_var, test_size = 0.2, random_state = 0) print(cl('X_train shape : {}'.format(X_train.shape), attrs = ['bold'], color = 'black')) print(cl('X_test shape : {}'.format(X_test.shape), attrs = ['bold'], color = 'black')) print(cl('y_train shape : {}'.format(y_train.shape), attrs = ['bold'], color = 'black')) print(cl('y_test shape : {}'.format(y_test.shape), attrs = ['bold'], color = 'black'))輸出:
X_train shape : (160, 5) X_test shape : (40, 5) y_train shape : (160,) y_test shape : (40,)
現在我們有了建構決策樹模型的所有元件。所以,讓我們繼續用python來建立我們的模型。
步驟5:建立模型和預測
在scikit學習套件提供的「DecisionTreeClassifier」演算法的幫助下,建立決策樹是可行的。之後,我們可以使用我們訓練過的模型來預測我們的資料。最後,我們的預測結果的精確度可以用「準確度」評估指標來計算。讓我們用python來完成這個過程!
Python實作:
model = dtc(criterion = 'entropy', max_depth = 4) model.fit(X_train, y_train) pred_model = model.predict(X_test) print(cl('Accuracy of the model is {:.0%}'.format(accuracy_score(y_test, pred_model)), attrs = ['bold']))輸出:
Accuracy of the model is 88%
在代码的第一步中,我们定义了一个名为“model”变量的变量,我们在其中存储DecisionTreeClassifier模型。接下来,我们将使用我们的训练集对模型进行拟合和训练。之后,我们定义了一个变量,称为“pred_model”变量,其中我们将模型预测的所有值存储在数据上。最后,我们计算了我们的预测值与实际值的精度,其准确率为88%。
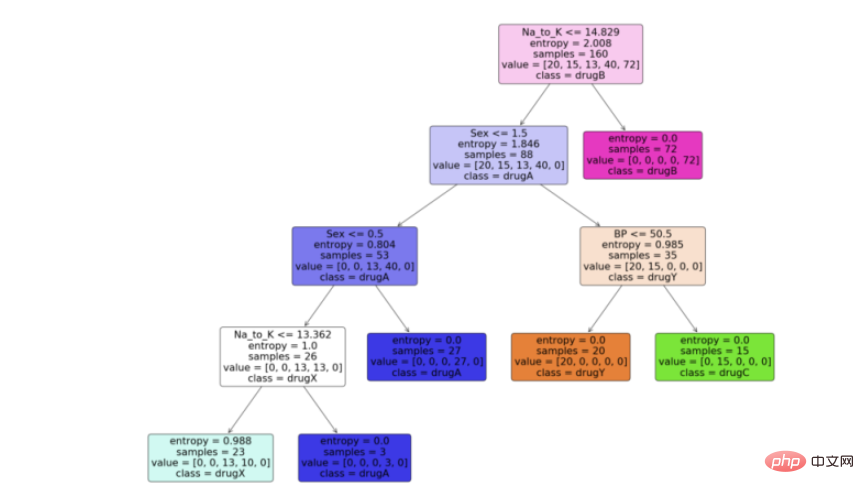
步骤6:可视化模型
现在我们有了决策树模型,让我们利用python中scikit learn包提供的“plot_tree”函数来可视化它。按照代码从python中的决策树模型生成一个漂亮的树图。
Python实现:
feature_names = df.columns[:5] target_names = df['Drug'].unique().tolist() plot_tree(model, feature_names = feature_names, class_names = target_names, filled = True, rounded = True) plt.savefig('tree_visualization.png')输出:
结论
有很多技术和其他算法用于优化决策树和避免过拟合,比如剪枝。虽然决策树通常是不稳定的,这意味着数据的微小变化会导致最优树结构的巨大变化,但其简单性使其成为广泛应用的有力候选。在神经网络流行之前,决策树是机器学习中最先进的算法。其他一些集成模型,比如随机森林模型,比普通决策树模型更强大。
决策树由于其简单性和可解释性而非常强大。决策树和随机森林在用户注册建模、信用评分、故障预测、医疗诊断等领域有着广泛的应用。我为本文提供了完整的代码。
完整代码:
import pandas as pd # 数据处理 import numpy as np # 使用数组 import matplotlib.pyplot as plt # 可视化 from matplotlib import rcParams # 图大小 from termcolor import colored as cl # 文本自定义 from sklearn.tree import DecisionTreeClassifier as dtc # 树算法 from sklearn.model_selection import train_test_split # 拆分数据 from sklearn.metrics import accuracy_score # 模型准确度 from sklearn.tree import plot_tree # 树图 rcParams['figure.figsize'] = (25, 20) df = pd.read_csv('drug.csv') df.drop('Unnamed: 0', axis = 1, inplace = True) print(cl(df.head(), attrs = ['bold'])) df.info() for i in df.Sex.values: if i == 'M': df.Sex.replace(i, 0, inplace = True) else: df.Sex.replace(i, 1, inplace = True) for i in df.BP.values: if i == 'LOW': df.BP.replace(i, 0, inplace = True) elif i == 'NORMAL': df.BP.replace(i, 1, inplace = True) elif i == 'HIGH': df.BP.replace(i, 2, inplace = True) for i in df.Cholesterol.values: if i == 'LOW': df.Cholesterol.replace(i, 0, inplace = True) else: df.Cholesterol.replace(i, 1, inplace = True) print(cl(df, attrs = ['bold'])) X_var = df[['Sex', 'BP', 'Age', 'Cholesterol', 'Na_to_K']].values # 自变量 y_var = df['Drug'].values # 因变量 print(cl('X variable samples : {}'.format(X_var[:5]), attrs = ['bold'])) print(cl('Y variable samples : {}'.format(y_var[:5]), attrs = ['bold'])) X_train, X_test, y_train, y_test = train_test_split(X_var, y_var, test_size = 0.2, random_state = 0) print(cl('X_train shape : {}'.format(X_train.shape), attrs = ['bold'], color = 'red')) print(cl('X_test shape : {}'.format(X_test.shape), attrs = ['bold'], color = 'red')) print(cl('y_train shape : {}'.format(y_train.shape), attrs = ['bold'], color = 'green')) print(cl('y_test shape : {}'.format(y_test.shape), attrs = ['bold'], color = 'green')) model = dtc(criterion = 'entropy', max_depth = 4) model.fit(X_train, y_train) pred_model = model.predict(X_test) print(cl('Accuracy of the model is {:.0%}'.format(accuracy_score(y_test, pred_model)), attrs = ['bold'])) feature_names = df.columns[:5] target_names = df['Drug'].unique().tolist() plot_tree(model, feature_names = feature_names, class_names = target_names, filled = True, rounded = True) plt.savefig('tree_visualization.png')以上是Python如何建構一個決策樹的詳細內容。更多資訊請關注PHP中文網其他相關文章!

熱AI工具

Undresser.AI Undress
人工智慧驅動的應用程序,用於創建逼真的裸體照片

AI Clothes Remover
用於從照片中去除衣服的線上人工智慧工具。

Undress AI Tool
免費脫衣圖片

Clothoff.io
AI脫衣器

Video Face Swap
使用我們完全免費的人工智慧換臉工具,輕鬆在任何影片中換臉!

熱門文章
熱工具

記事本++7.3.1
好用且免費的程式碼編輯器

SublimeText3漢化版
中文版,非常好用

禪工作室 13.0.1
強大的PHP整合開發環境

Dreamweaver CS6
視覺化網頁開發工具

SublimeText3 Mac版
神級程式碼編輯軟體(SublimeText3)


 PHP和Python:解釋了不同的範例
Apr 18, 2025 am 12:26 AM
PHP和Python:解釋了不同的範例
Apr 18, 2025 am 12:26 AM
PHP主要是過程式編程,但也支持面向對象編程(OOP);Python支持多種範式,包括OOP、函數式和過程式編程。 PHP適合web開發,Python適用於多種應用,如數據分析和機器學習。
 在PHP和Python之間進行選擇:指南
Apr 18, 2025 am 12:24 AM
在PHP和Python之間進行選擇:指南
Apr 18, 2025 am 12:24 AM
PHP適合網頁開發和快速原型開發,Python適用於數據科學和機器學習。 1.PHP用於動態網頁開發,語法簡單,適合快速開發。 2.Python語法簡潔,適用於多領域,庫生態系統強大。
 Python vs. JavaScript:學習曲線和易用性
Apr 16, 2025 am 12:12 AM
Python vs. JavaScript:學習曲線和易用性
Apr 16, 2025 am 12:12 AM
Python更適合初學者,學習曲線平緩,語法簡潔;JavaScript適合前端開發,學習曲線較陡,語法靈活。 1.Python語法直觀,適用於數據科學和後端開發。 2.JavaScript靈活,廣泛用於前端和服務器端編程。
 vs code 可以在 Windows 8 中運行嗎
Apr 15, 2025 pm 07:24 PM
vs code 可以在 Windows 8 中運行嗎
Apr 15, 2025 pm 07:24 PM
VS Code可以在Windows 8上運行,但體驗可能不佳。首先確保系統已更新到最新補丁,然後下載與系統架構匹配的VS Code安裝包,按照提示安裝。安裝後,注意某些擴展程序可能與Windows 8不兼容,需要尋找替代擴展或在虛擬機中使用更新的Windows系統。安裝必要的擴展,檢查是否正常工作。儘管VS Code在Windows 8上可行,但建議升級到更新的Windows系統以獲得更好的開發體驗和安全保障。
 PHP和Python:深入了解他們的歷史
Apr 18, 2025 am 12:25 AM
PHP和Python:深入了解他們的歷史
Apr 18, 2025 am 12:25 AM
PHP起源於1994年,由RasmusLerdorf開發,最初用於跟踪網站訪問者,逐漸演變為服務器端腳本語言,廣泛應用於網頁開發。 Python由GuidovanRossum於1980年代末開發,1991年首次發布,強調代碼可讀性和簡潔性,適用於科學計算、數據分析等領域。
 visual studio code 可以用於 python 嗎
Apr 15, 2025 pm 08:18 PM
visual studio code 可以用於 python 嗎
Apr 15, 2025 pm 08:18 PM
VS Code 可用於編寫 Python,並提供許多功能,使其成為開發 Python 應用程序的理想工具。它允許用戶:安裝 Python 擴展,以獲得代碼補全、語法高亮和調試等功能。使用調試器逐步跟踪代碼,查找和修復錯誤。集成 Git,進行版本控制。使用代碼格式化工具,保持代碼一致性。使用 Linting 工具,提前發現潛在問題。
 vscode怎麼在終端運行程序
Apr 15, 2025 pm 06:42 PM
vscode怎麼在終端運行程序
Apr 15, 2025 pm 06:42 PM
在 VS Code 中,可以通過以下步驟在終端運行程序:準備代碼和打開集成終端確保代碼目錄與終端工作目錄一致根據編程語言選擇運行命令(如 Python 的 python your_file_name.py)檢查是否成功運行並解決錯誤利用調試器提升調試效率
 vscode 擴展是否是惡意的
Apr 15, 2025 pm 07:57 PM
vscode 擴展是否是惡意的
Apr 15, 2025 pm 07:57 PM
VS Code 擴展存在惡意風險,例如隱藏惡意代碼、利用漏洞、偽裝成合法擴展。識別惡意擴展的方法包括:檢查發布者、閱讀評論、檢查代碼、謹慎安裝。安全措施還包括:安全意識、良好習慣、定期更新和殺毒軟件。
