我們將在本文中衡量交易策略的表現。並將發展一個簡單的動量交易策略,它將使用四種資產類別:債券、股票和房地產。這些資產類別的相關性很低,這使得它們成為了極佳的風險平衡選擇。

這個策略是基於動量的的,因為交易者和投資者早就意識到動量的影響,這可以在廣泛的市場和時間框架中看到。所以我們稱之為動量策略。趨勢追蹤或時間序列動量 (TSM) 是在單一工具上使用這些策略的另一個名稱。我們將建立一個基本的動量策略並在 TCS 上進行測試以查看其效能。
首先,我們將匯入一些函式庫
import numpy as np
 import pandas as pd
 import matplotlib.pyplot as plt
 import yfinance as yf
 import ffn
 %matplotlib inline
我們建構基本的動量策略函數TSMStrategy。函數將透過時間序列的對數回報、感興趣的時間段以及是否允許做空的布林變數的布林變數來傳回預期表現。
def TSMStrategy(returns, period=1, shorts=False):
if shorts:
position = returns.rolling(period).mean().map(
lambda x: -1 if x <= 0 else 1)
else:
position = returns.rolling(period).mean().map(
lambda x: 0 if x <= 0 else 1)
performance = position.shift(1) * returns
return performance
 ticker = 'TCS'
 yftcs = yf.Ticker(ticker)
 data = yftcs.history(start='2005-01-01', end='2021-12-31')
 returns = np.log(data['Close'] / data['Close'].shift(1)).dropna()
 performance = TSMStrategy(returns, period=1, shorts=False).dropna()
 years = (performance.index.max() - performance.index.min()).days / 365
 perf_cum = np.exp(performance.cumsum())
 tot = perf_cum[-1] - 1
 ann = perf_cum[-1] ** (1 / years) - 1
 vol = performance.std() * np.sqrt(252)
 rfr = 0.02
 sharpe = (ann - rfr) / vol
 print(f"1-day TSM Strategy yields:" +
f"nt{tot*100:.2f}% total returns" +
f"nt{ann*100:.2f}% annual returns" +
f"nt{sharpe:.2f} Sharpe Ratio")
 tcs_ret = np.exp(returns.cumsum())
 b_tot = tcs_ret[-1] - 1
 b_ann = tcs_ret[-1] ** (1 / years) - 1
 b_vol = returns.std() * np.sqrt(252)
 b_sharpe = (b_ann - rfr) / b_vol
 print(f"Baseline Buy-and-Hold Strategy yields:" +
f"nt{b_tot*100:.2f}% total returns" +
f"nt{b_ann*100:.2f}% annual returns" +
f"nt{b_sharpe:.2f} Sharpe Ratio")函數輸出如下:
1-day TSM Strategy yields:
 -45.15% total returns
 -7.10% annual returns
 -0.17 Sharpe Ratio
 Baseline Buy-and-Hold Strategy yields:
 -70.15% total returns
 -13.78% annual returns
 -0.22 Sharpe Ratio
在合理的年化報酬率上,1日TSM策略優於買入並持有策略。因為 1 天的回顧可能包含許多錯誤趨勢,所以我們嘗試不同的時間段來查看它們的比較。這裡將循環運行模型 3、5、15、30 和 90 天。
 import matplotlib.gridspec as gridspec
 periods = [3, 5, 15, 30, 90]
 fig = plt.figure(figsize=(12, 10))
 gs = fig.add_gridspec(4, 4)
 ax0 = fig.add_subplot(gs[:2, :4])
 ax1 = fig.add_subplot(gs[2:, :2])
 ax2 = fig.add_subplot(gs[2:, 2:])
 ax0.plot((np.exp(returns.cumsum()) - 1) * 100, label=ticker, linestyle='-')
 perf_dict = {'tot_ret': {'buy_and_hold': (np.exp(returns.sum()) - 1)}}
 perf_dict['ann_ret'] = {'buy_and_hold': b_ann}
 perf_dict['sharpe'] = {'buy_and_hold': b_sharpe}
 for p in periods:
log_perf = TSMStrategy(returns, period=p, shorts=False)
perf = np.exp(log_perf.cumsum())
perf_dict['tot_ret'][p] = (perf[-1] - 1)
ann = (perf[-1] ** (1/years) - 1)
perf_dict['ann_ret'][p] = ann
vol = log_perf.std() * np.sqrt(252)
perf_dict['sharpe'][p] = (ann - rfr) / vol
ax0.plot((perf - 1) * 100, label=f'{p}-Day Mean')

 ax0.set_ylabel('Returns (%)')
 ax0.set_xlabel('Date')
 ax0.set_title('Cumulative Returns')
 ax0.grid()
 ax0.legend()
 _ = [ax1.bar(i, v * 100) for i, v in enumerate(perf_dict['ann_ret'].values())]
 ax1.set_xticks([i for i, k in enumerate(perf_dict['ann_ret'])])
 ax1.set_xticklabels([f'{k}-Day Mean'
if type(k) is int else ticker for
k in perf_dict['ann_ret'].keys()],
rotation=45)
 ax1.grid()
 ax1.set_ylabel('Returns (%)')
 ax1.set_xlabel('Strategy')
 ax1.set_title('Annual Returns')
 _ = [ax2.bar(i, v) for i, v in enumerate(perf_dict['sharpe'].values())]
 ax2.set_xticks([i for i, k in enumerate(perf_dict['sharpe'])])
 ax2.set_xticklabels([f'{k}-Day Mean'
if type(k) is int else ticker for
k in perf_dict['sharpe'].keys()],
rotation=45)
 ax2.grid()
 ax2.set_ylabel('Sharpe Ratio')
 ax2.set_xlabel('Strategy')
 ax2.set_title('Sharpe Ratio')
 plt.tight_layout()
 plt.show()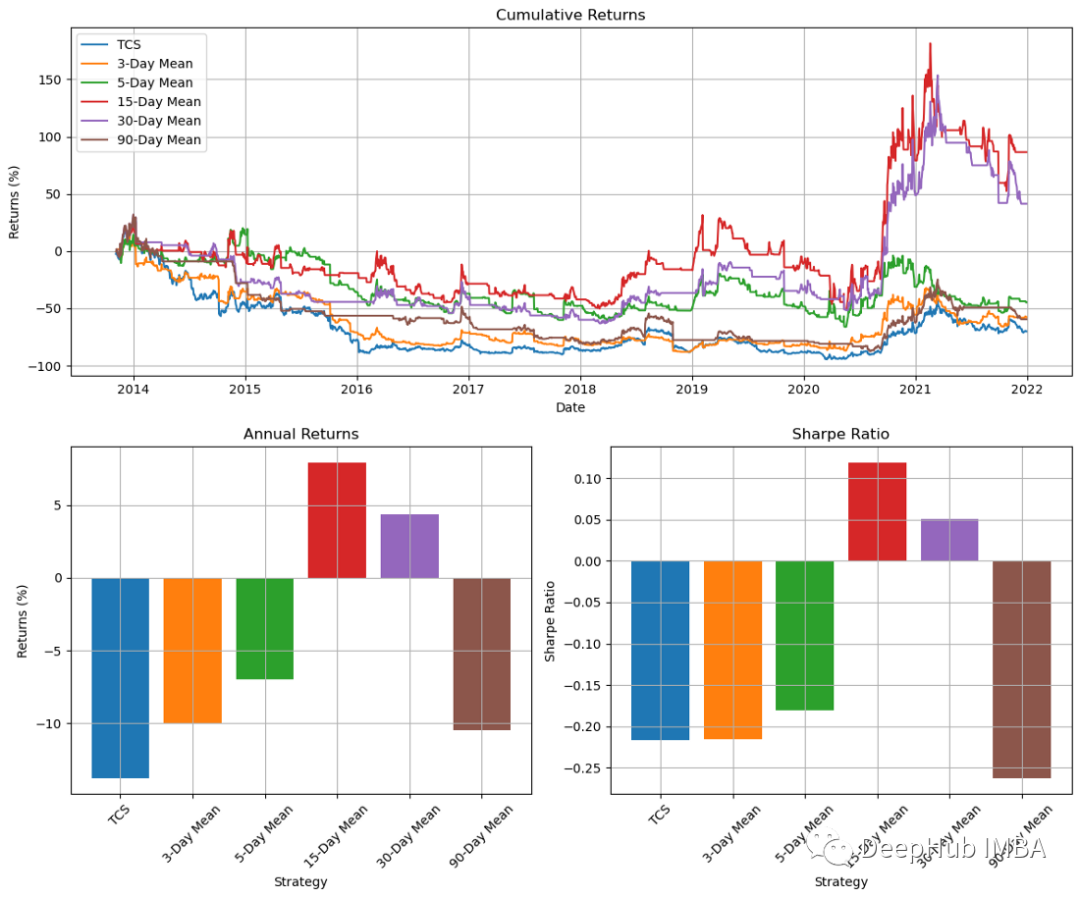
透過圖表的結果,我們可以看到15天的動量指標提供了最好的結果。但是,其他時間週期的結果是五花八門的。這顯示我們這個策略並不可靠。所以我們還可以透過在接近頂部時使用止損或追蹤停損來退出交易,而不是在15日線圖下跌或持平時再進行操作。
到目前為止,我們已經用Python創建了一個交易策略。下面我們將測量並繪製常見的投資組合特徵方便我們進行觀察分析。
首先,我們將導入一些重要的函式庫,並觀察資料執行情況。
import pandas_datareader.data as web
 stocks = ['SPY','GLD','TLT','HYG']

 data = web.DataReader(stocks,data_source='yahoo',start='01/01/2019')['Adj Close']
 data.sort_index(ascending=True,inplace=True)
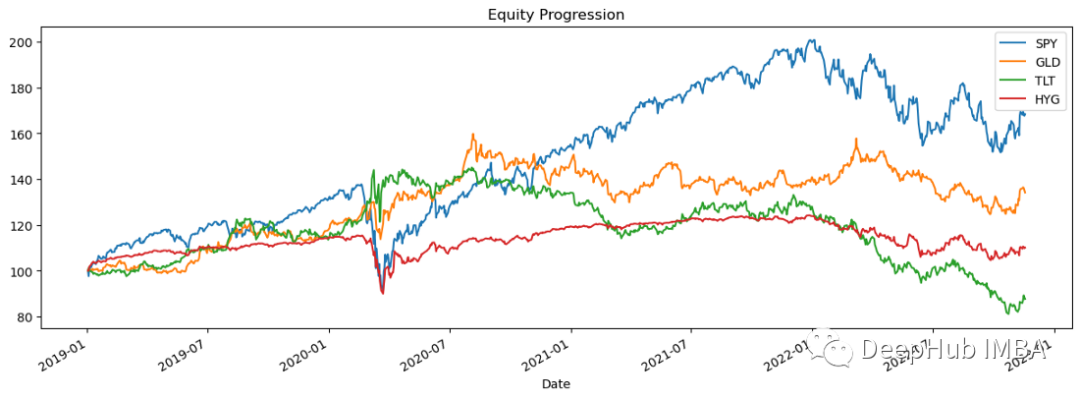
 perf = data.calc_stats()
 perf.plot()
對數回報用於計算指數成長率。我們不計算每個子時期的價格變化百分比,而是計算那段時間的自然成長指數。首先建立一個df,其中包含資料中每個股票價格的對數回報,然後我們為每個對數回報建立一個直方圖。
 returns = data.to_log_returns().dropna()
 print(returns.head())


 Symbols SPY GLD TLT HYG
 Date
 2019-01-03 -0.024152 0.009025 0.011315 0.000494
 2019-01-04 0.032947 -0.008119 -0.011642 0.016644
 2019-01-07 0.007854 0.003453 -0.002953 0.009663
 2019-01-08 0.009351 -0.002712 -0.002631 0.006470
 2019-01-09 0.004663 0.006398 -0.001566 0.001193
直方圖如下:
ax = returns.hist(figsize=(20, 10),bins=30)
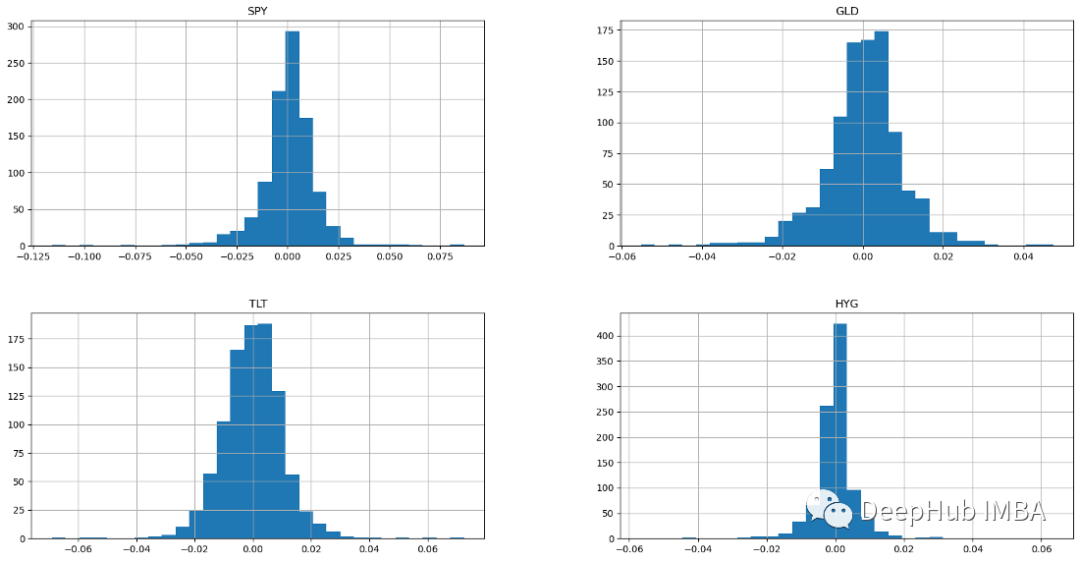
#所有四個資產類別都顯示常態分佈的直方圖。具有常態分佈的樣本具有算術平均值和高於和低於平均值的均等分佈(常態分佈也稱為高斯分佈是對稱的) 。如果回報呈常態分佈,預計超過 99% 的回報將落在平均值的三個標準差範圍內。這些鐘形常態分佈特徵使分析師和投資者能夠對股票的預期收益和風險進行更好的統計推論。具有鐘形曲線的股票通常是波動率低且可預測的藍籌股(Blue Chips)。
DRAWDOWN是指價值下降到一個相對的低潮。這是投資者需要考慮的重要風險因素。讓我們畫一個遞減策略的視覺化表示。
ffn.to_drawdown_series(data).plot(figsize=(15,10))
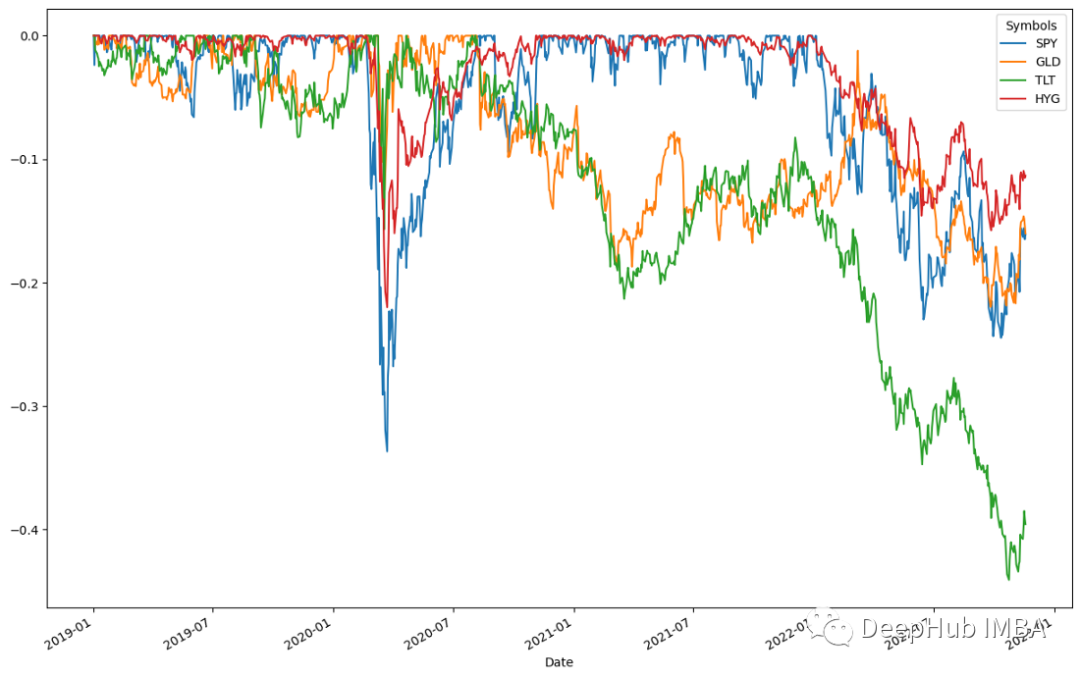
這四種資產在2020年上半年都出現了下降,其中SPY的降幅最大,為0.5%。隨後,在2020年上半年,所有資產立即復甦。這表示資產回收率很高。這些資產在2020年7月前後見頂。依照這個趨勢,一旦復甦達到頂峰,所有資產類別都出現小幅下跌。根據結果TLT將在2022年下半年經歷最大的0.5%的下降,然後在2023年初之前恢復。
1952年,馬科維茲(MARKOWITZ)提出均值-方差投資組合理論,又稱現代投資組合理論。投資者可以使用這些概念來建立基於給定風險水準的最大化預期回報的投資組合。基於馬科維茨方法,我們可以產生「最優投資組合」。
returns.calc_mean_var_weights().as_format('.2%')
 #结果
 SPY 46.60%
 GLD 53.40%
 TLT 0.00%
 HYG 0.00%
dtype: object相關性是一種統計方法,用來衡量證券之間的相互關係。最好使用熱圖來查看這些資訊。熱圖可以讓我們看到證券之間的相關性。
returns.plot_corr_heatmap()
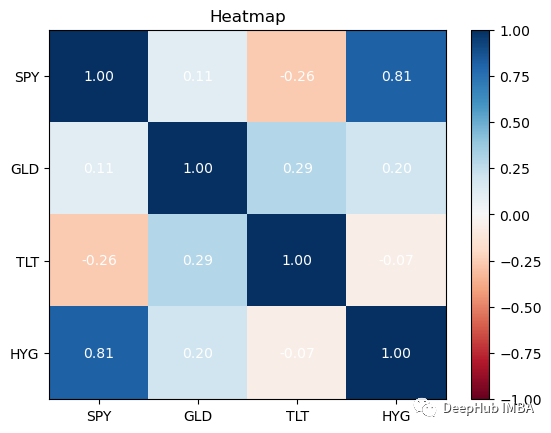
最好在你的投资组合中拥有相关性较低的资产。除了SPY与HYG,这四个资产类别的相关性都很低,这对我们的投资组合是不利的:因为如果拥有高度相关的不同资产组,即使你将风险分散在它们之间,从投资组合构建的角度来看,收益也会很少。
通过分析和绘制的所有数据进行资产配置,可以建立一个投资组合,极大地改变基础投资的风险特征。还有很多我没有提到的,但可以帮助我们确定交易策略价值的起点。我们将在后续文章中添加更多的技术性能指标。
以上是使用Python進行交易策略和投資組合分析的詳細內容。更多資訊請關注PHP中文網其他相關文章!


