
時間序列是一系列在固定時間間隔記錄的資料點。它用於研究模式的趨勢、變數之間的關係以及定義的時間內的變化。時間序列的常見例子包括股票價格、天氣模式和經濟指標。
透過統計和數學技術對時間序列資料進行分析。時間序列的主要目的是識別先前資料的模式和趨勢,以預測未來的值。
The data is said to be stationary, if it doesn't change with the time. It is necessary to check if the data is stationary or not. There are different ways to check if time ser data is tationies data is sary, the check if time ser data is tationies, mletm the check datas them the data is's ,mlet data is's , data. one by one.
Augmented Dickey-Fuller(ADF) is a statistical test which checks for the presence of the unit roots available in the time series data. The unit root is the data which is non stationary. It returns the test static and p value the output.
在輸出中,如果p值低於0.05,則表示非平穩時間序列資料。以下是ADF平穩資料的範例。我們在Python中有一個名為adfuller()的函數,它在statsmodel 套件中可用來檢查時間序列資料是否平穩。
In this example we are finding the ADF statistic and p-value of the Augmented Dickey Fuller using the adfuller() function of the statsmodel package of python.
from statsmodels.tsa.stattools import adfuller
import pandas as pd
data = pd.read_csv('https://raw.githubusercontent.com/selva86/datasets/master/a10.csv',parse_dates=['date'], index_col='date')
t_data = data.loc[:, 'value'].values
result = adfuller(t_data)
print("The result of adfuller function:",result)
print('ADF Statistic:', result[0])
print('p-value:', result[1])
Following is the output produced after executing the program above –
The result of adfuller function: (3.145185689306744, 1.0, 15, 188, {'1%': -3.465620397124192, '5%': -2.8770397560752436, '10%': -2.5750324547306476}, 549.6705685364172)
ADF Statistic: 3.145185689306744
p-value: 1.0
檢查單位根的另一種測試是KPSS測試。它的縮寫是Kwiatkowski-Phillips-Schmidt-Shin。我們在statsmodels套件中有一個名為kpss()的函數,用來檢查時間序列資料中的單位根。
下面是一個在時間序列資料中尋找單位根的範例。
from statsmodels.tsa.stattools import kpss
import pandas as pd
data = pd.read_csv('https://raw.githubusercontent.com/selva86/datasets/master/a10.csv',parse_dates=['date'], index_col='date')
t_data = data.loc[:, 'value'].values
from statsmodels.tsa.stattools import kpss
result = kpss(data)
print("The result of kpss function:",result)
print('KPSS Statistic:', result[0])
print('p-value:', result[1])
以下是statsmodels套件中kpss()函數的輸出結果。
The result of kpss function: (2.0131256386303322, 0.01, 9, {'10%': 0.347, '5%': 0.463, '2.5%': 0.574, '1%': 0.739})
KPSS Statistic: 2.0131256386303322
p-value: 0.01
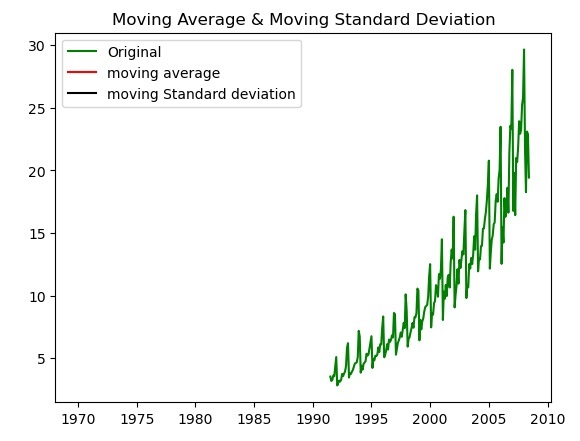
檢查時間序列資料的另一種方法是繪製給定時間序列資料的移動平均值和移動標準差,並檢查資料是否保持恆定。如果在圖表中資料隨時間變化,則時間序列資料是非平穩的。
The following is the example for checking the data variation by plotting the moving average and moving standard deviation using the matplotlib library plot() function.
import pandas as pd
import matplotlib.pyplot as plt
data = pd.read_csv('https://raw.githubusercontent.com/selva86/datasets/master/a10.csv',parse_dates=['date'], index_col='date')
t_data = data.loc[:, 'value'].values
moving_avg = t_data.mean()
moving_std = t_data.std()
plt.plot(data, color='green', label='Original')
plt.plot(moving_avg, color='red', label='moving average')
plt.plot(moving_std, color='black', label='moving Standard deviation')
plt.legend(loc='best')
plt.title('Moving Average & Moving Standard Deviation')
plt.show()
以下是透過繪製移動平均值和移動標準差對時間序列資料進行標準化的輸出。
以上是如何使用Python檢查時間序列資料是否是平穩的?的詳細內容。更多資訊請關注PHP中文網其他相關文章!


