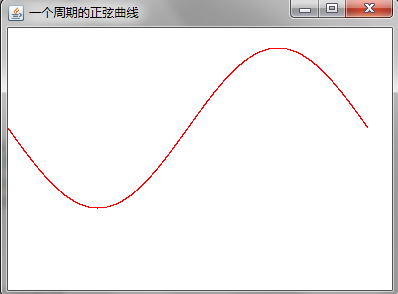
繪製正弦曲線:
import java.awt.*;
import java.awt.geom.*;
import javax.swing.*;
import java.lang.*;
public class sinx {
public static void main(String[] args) {
DrawFrame frame = new DrawFrame();
frame.setDefaultCloseOperation(JFrame.EXIT_ON_CLOSE);
frame.show();
}
}
class DrawFrame extends JFrame {
public DrawFrame() {
//設定標題,視窗大小
setTitle("sinx");
setSize(WIDTH, HEIGHT);
DrawPanel panel = new DrawPanel();
Container contentPane = getContentPane();
contentPane.add(panel);
}
public static final int WIDTH = 400;
public static final int HEIGHT = 400;
}
class DrawPanel extends JPanel {
public void paintComponent(Graphics g) {
super.paintComponent(g);
Graphics2D g2 = (Graphics2D)g;
int x,y;
double a;
//畫正弦曲線
//Graphics g=getGraphics();
for(x=0;x{
a=Math.sin(x*Math.PI/180);
y=(int)(80 40*a);
g2.drawString("*",x,y);
}
}
}
寫得比較簡單哈。
package OnlineUserCount;
import java.awt.*;
import javax.swing.*;
public class Sin extends JPanel{
private double x;
private double y;
@Override
protected void paintComponent(Graphics g) {
// TODO Auto-generated method stub
super.paintComponent(g);
g.setColor(Color.WHITE);//設定面板背景色
g.fillRect(0, 0, 400, 300);//填充面板
g.setColor(Color.RED);//設定畫線的顏色
for(x=0;x
{
y=Math.sin(x*Math. PI/180);//轉換為弧度,1度=π/180弧度
y=(100 80*y);//方便在螢幕上顯示
//g.drawString(".",(int)x,(int)y);//用這種方式也可以
g.drawLine((int)x, (int)y, (int)x,(int) y);//畫點
}
}
public static void main(String []args){
Sin s= new Sin();
JFrame j=new JFrame();
j.setTitle("一個週期的正弦曲線");
j.add(s);
j.setSize(400, 300);
j.setDefaultCloseOperation(JFrame.EXIT_ON_CLOSE);
j.setVisible(true);
}
}
//效果截圖
以上是使用Java設計並實作一個應用程式繪製以下函數的圖像:的詳細內容。更多資訊請關注PHP中文網其他相關文章!


