透過學習曲線辨識過擬合和欠擬合
本文將介紹如何透過學習曲線來有效辨識機器學習模型中的過度擬合和欠擬合。
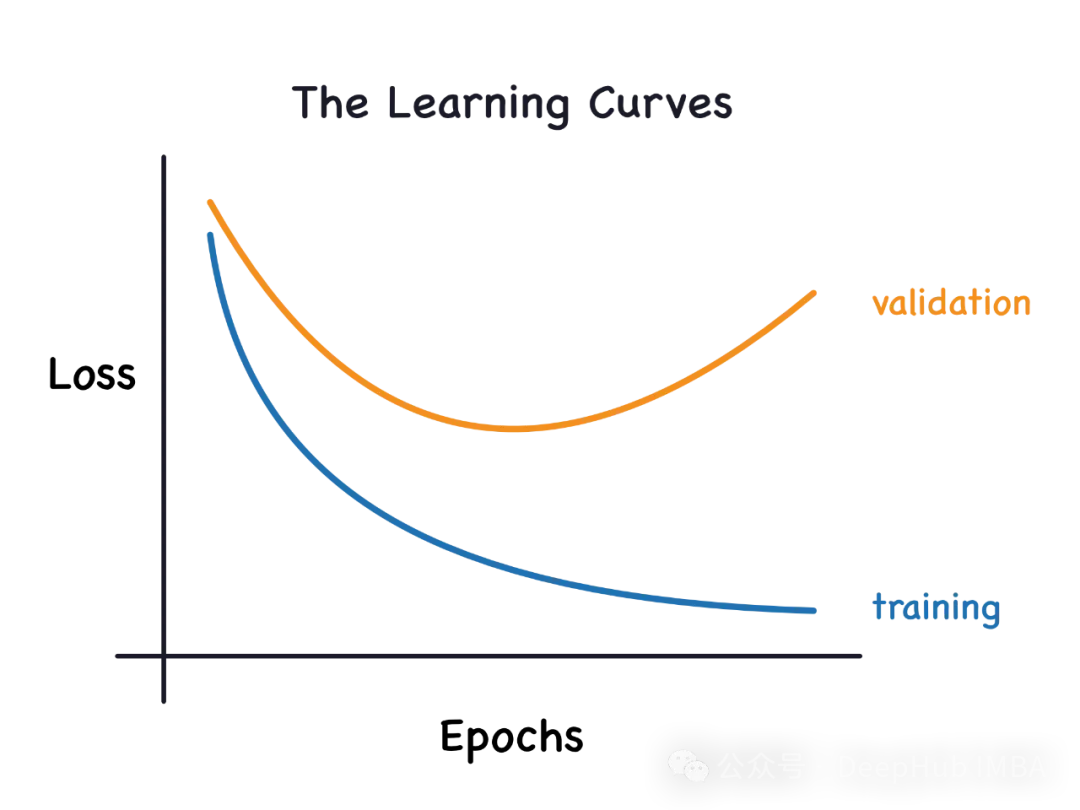
欠擬合與過擬合
#1、過擬合
如果一個模型對資料進行了過度訓練,以至於它從中學習了噪聲,那麼這個模型就被稱為過度擬合。過度擬合模型非常完美地學習了每一個例子,所以它會錯誤地分類一個看不見的/新的例子。對於一個過度擬合的模型,我們會得到一個完美/接近完美的訓練集分數和一個糟糕的驗證集/測試分數。
略有修改:「過度擬合的原因:用一個複雜的模型來解決一個簡單的問題,從資料中提取雜訊。因為小資料集作為訓練集可能無法代表所有資料的正確表示。就說它是欠擬合的。欠擬合模型並不能完全學習資料集中的每一個例子。在這種情況下,我們看到訓練集和驗證集的誤差都很低。這可能是因為模型太簡單,沒有足夠的參數來適應數據。我們可以嘗試增加模型的複雜度,增加層數或神經元的數量,來解決欠擬合問題。但要注意的是,增加模型複雜度也會增加過度擬合的風險。
不足合適的原因: 使用一個簡單的模型來解決一個複雜的問題,這個模型不能學習資料中的所有模式,或是模型錯誤的學習了底層資料的模式。 在資料分析和機器學習中,模型的選擇是非常重要的。選擇適合問題的模型可以提高預測的準確性和可靠性。對於複雜的問題,可能需要使用更複雜的模型來捕捉資料中的所有模式。另外,還需要考慮
學習曲線
學習曲線透過增量增加新的訓練樣本來繪製訓練樣本樣本本身的訓練和驗證損失。可以幫助我們確定是否需要添加額外的訓練範例來提高驗證分數(在未見過的數據上得分)。如果模型是過度擬合的,那麼添加額外的訓練範例可能會提高模型在未見過的資料上的表現。同理,如果一個模型是欠擬合的,那麼添加訓練範例也許沒有什麼用。 'learning_curve'方法可以從Scikit-Learn的'model_selection'模組導入。
from sklearn.model_selection import learning_curve
登入後複製
我們將使用邏輯迴歸和Iris資料進行示範。建立一個名為「learn_curve」的函數,它將擬合邏輯迴歸模型,並傳回交叉驗證分數、訓練分數和學習曲線資料。 from sklearn.model_selection import learning_curve
#The function below builds the model and returns cross validation scores, train score and learning curve data def learn_curve(X,y,c): ''' param X: Matrix of input featuresparam y: Vector of Target/Labelc: Inverse Regularization variable to control overfitting (high value causes overfitting, low value causes underfitting)''' '''We aren't splitting the data into train and test because we will use StratifiedKFoldCV.KFold CV is a preferred method compared to hold out CV, since the model is tested on all the examples.Hold out CV is preferred when the model takes too long to train and we have a huge test set that truly represents the universe''' le = LabelEncoder() # Label encoding the target sc = StandardScaler() # Scaling the input features y = le.fit_transform(y)#Label Encoding the target log_reg = LogisticRegression(max_iter=200,random_state=11,C=c) # LogisticRegression model # Pipeline with scaling and classification as steps, must use a pipelne since we are using KFoldCV lr = Pipeline(steps=(['scaler',sc],['classifier',log_reg])) cv = StratifiedKFold(n_splits=5,random_state=11,shuffle=True) # Creating a StratifiedKFold object with 5 folds cv_scores = cross_val_score(lr,X,y,scoring="accuracy",cv=cv) # Storing the CV scores (accuracy) of each fold lr.fit(X,y) # Fitting the model train_score = lr.score(X,y) # Scoring the model on train set #Building the learning curve train_size,train_scores,test_scores =learning_curve(estimator=lr,X=X,y=y,cv=cv,scoring="accuracy",random_state=11) train_scores = 1-np.mean(train_scores,axis=1)#converting the accuracy score to misclassification rate test_scores = 1-np.mean(test_scores,axis=1)#converting the accuracy score to misclassification rate lc =pd.DataFrame({"Training_size":train_size,"Training_loss":train_scores,"Validation_loss":test_scores}).melt(id_vars="Training_size") return {"cv_scores":cv_scores,"train_score":train_score,"learning_curve":lc}1、擬合模型的學習曲線
我們將使用'learn_curve'函數透過將反正則化變數/參數'c'設為1來獲得一個良好的擬合模型(即我們不執行任何正則化)。
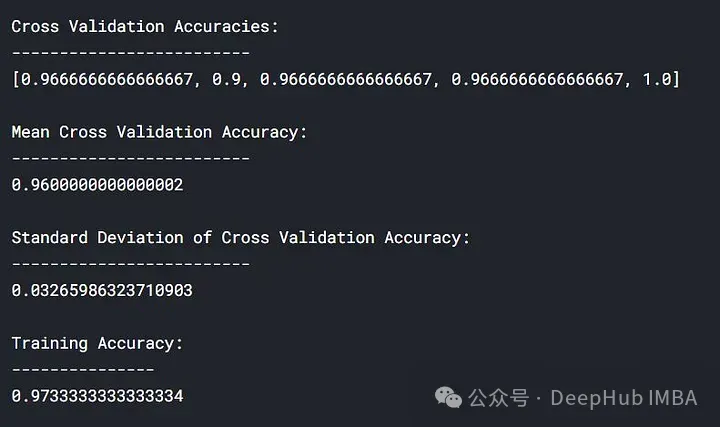
lc = learn_curve(X,y,1) print(f'Cross Validation Accuracies:\n{"-"*25}\n{list(lc["cv_scores"])}\n\n\ Mean Cross Validation Accuracy:\n{"-"*25}\n{np.mean(lc["cv_scores"])}\n\n\ Standard Deviation of Deep HUB Cross Validation Accuracy:\n{"-"*25}\n{np.std(lc["cv_scores"])}\n\n\ Training Accuracy:\n{"-"*15}\n{lc["train_score"]}\n\n') sns.lineplot(data=lc["learning_curve"],x="Training_size",y="value",hue="variable") plt.title("Learning Curve of Good Fit Model") plt.ylabel("Misclassification Rate/Loss");登入後複製
lc = learn_curve(X,y,1) print(f'Cross Validation Accuracies:\n{"-"*25}\n{list(lc["cv_scores"])}\n\n\ Mean Cross Validation Accuracy:\n{"-"*25}\n{np.mean(lc["cv_scores"])}\n\n\ Standard Deviation of Deep HUB Cross Validation Accuracy:\n{"-"*25}\n{np.std(lc["cv_scores"])}\n\n\ Training Accuracy:\n{"-"*15}\n{lc["train_score"]}\n\n') sns.lineplot(data=lc["learning_curve"],x="Training_size",y="value",hue="variable") plt.title("Learning Curve of Good Fit Model") plt.ylabel("Misclassification Rate/Loss");在上面的結果中,交叉驗證準確率與訓練準確率接近。
訓練的損失(藍色):一個好的擬合模型的學習曲線會隨著訓練範例的增加而逐漸減少並逐漸趨於平坦,說明增加更多的訓練範例並不能提升模型在訓練資料上的表現。
驗證的損失(黃色):一個好的擬合模型的學習曲線在開始時具有較高的驗證損失,隨著訓練範例的增加逐漸減少並逐漸趨於平坦,說明樣本越多,就能夠學習到更多的模式,這些模式對於”看不到“的數據會有幫助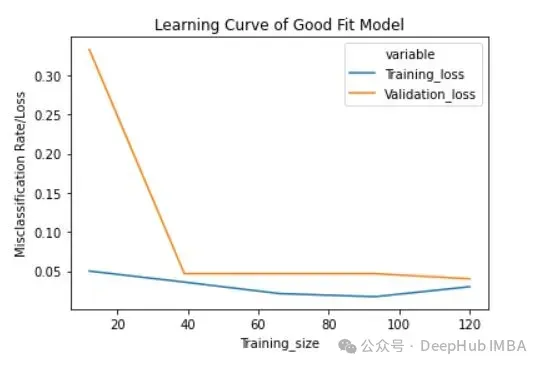
最後還可以看到,在增加合理數量的訓練範例後,訓練損失和驗證損失彼此接近。
2、過度擬合模型的學習曲線
#我們將使用' learn_curve '函數透過將反正則化變數/參數' c '設定為10000來獲得過擬合模型(' c '的高值導致過擬合)。
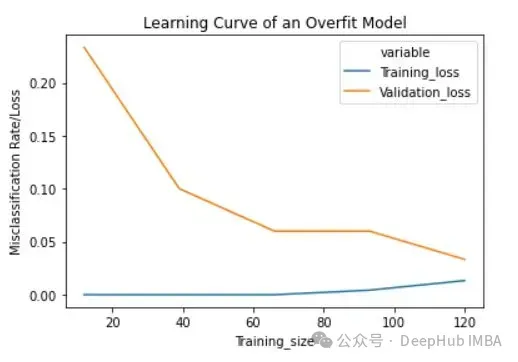
lc = learn_curve(X,y,10000) print(f'Cross Validation Accuracies:\n{"-"*25}\n{list(lc["cv_scores"])}\n\n\ Mean Cross Validation Deep HUB Accuracy:\n{"-"*25}\n{np.mean(lc["cv_scores"])}\n\n\ Standard Deviation of Cross Validation Accuracy:\n{"-"*25}\n{np.std(lc["cv_scores"])} (High Variance)\n\n\ Training Accuracy:\n{"-"*15}\n{lc["train_score"]}\n\n') sns.lineplot(data=lc["learning_curve"],x="Training_size",y="value",hue="variable") plt.title("Learning Curve of an Overfit Model") plt.ylabel("Misclassification Rate/Loss");登入後複製
#
与拟合模型相比,交叉验证精度的标准差较高。

过拟合模型的学习曲线一开始的训练损失很低,随着训练样例的增加,学习曲线逐渐增加,但不会变平。过拟合模型的学习曲线在开始时具有较高的验证损失,随着训练样例的增加逐渐减小并且不趋于平坦,说明增加更多的训练样例可以提高模型在未知数据上的性能。同时还可以看到,训练损失和验证损失彼此相差很远,在增加额外的训练数据时,它们可能会彼此接近。
3、欠拟合模型的学习曲线
将反正则化变量/参数' c '设置为1/10000来获得欠拟合模型(' c '的低值导致欠拟合)。
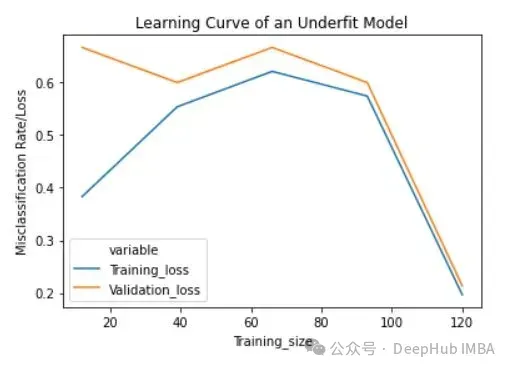
lc = learn_curve(X,y,1/10000) print(f'Cross Validation Accuracies:\n{"-"*25}\n{list(lc["cv_scores"])}\n\n\ Mean Cross Validation Accuracy:\n{"-"*25}\n{np.mean(lc["cv_scores"])}\n\n\ Standard Deviation of Cross Validation Accuracy:\n{"-"*25}\n{np.std(lc["cv_scores"])} (Low variance)\n\n\ Training Deep HUB Accuracy:\n{"-"*15}\n{lc["train_score"]}\n\n') sns.lineplot(data=lc["learning_curve"],x="Training_size",y="value",hue="variable") plt.title("Learning Curve of an Underfit Model") plt.ylabel("Misclassification Rate/Loss");登入後複製

与过拟合和良好拟合模型相比,交叉验证精度的标准差较低。

欠拟合模型的学习曲线在开始时具有较低的训练损失,随着训练样例的增加逐渐增加,并在最后突然下降到任意最小点(最小并不意味着零损失)。这种最后的突然下跌可能并不总是会发生。这表明增加更多的训练样例并不能提高模型在未知数据上的性能。
总结
在机器学习和统计建模中,过拟合(Overfitting)和欠拟合(Underfitting)是两种常见的问题,它们描述了模型与训练数据的拟合程度如何影响模型在新数据上的表现。
分析生成的学习曲线时,可以关注以下几个方面:
- 欠拟合:如果学习曲线显示训练集和验证集的性能都比较低,或者两者都随着训练样本数量的增加而缓慢提升,这通常表明模型欠拟合。这种情况下,模型可能太简单,无法捕捉数据中的基本模式。
- 过拟合:如果训练集的性能随着样本数量的增加而提高,而验证集的性能在一定点后开始下降或停滞不前,这通常表示模型过拟合。在这种情况下,模型可能太复杂,过度适应了训练数据中的噪声而非潜在的数据模式。
根据学习曲线的分析,你可以采取以下策略进行调整:
- 对于欠拟合:
- 增加模型复杂度,例如使用更多的特征、更深的网络或更多的参数。
- 改善特征工程,尝试不同的特征组合或转换。
- 增加迭代次数或调整学习率。
- 对于过拟合:
使用正则化技术(如L1、L2正则化)。
减少模型的复杂性,比如减少参数数量、层数或特征数量。
增加更多的训练数据。
应用数据增强技术。
使用早停(early stopping)等技术来避免过度训练。
通过这样的分析和调整,学习曲线能够帮助你更有效地优化模型,并提高其在未知数据上的泛化能力。
lc = learn_curve(X,y,10000) print(f'Cross Validation Accuracies:\n{"-"*25}\n{list(lc["cv_scores"])}\n\n\ Mean Cross Validation Deep HUB Accuracy:\n{"-"*25}\n{np.mean(lc["cv_scores"])}\n\n\ Standard Deviation of Cross Validation Accuracy:\n{"-"*25}\n{np.std(lc["cv_scores"])} (High Variance)\n\n\ Training Accuracy:\n{"-"*15}\n{lc["train_score"]}\n\n') sns.lineplot(data=lc["learning_curve"],x="Training_size",y="value",hue="variable") plt.title("Learning Curve of an Overfit Model") plt.ylabel("Misclassification Rate/Loss");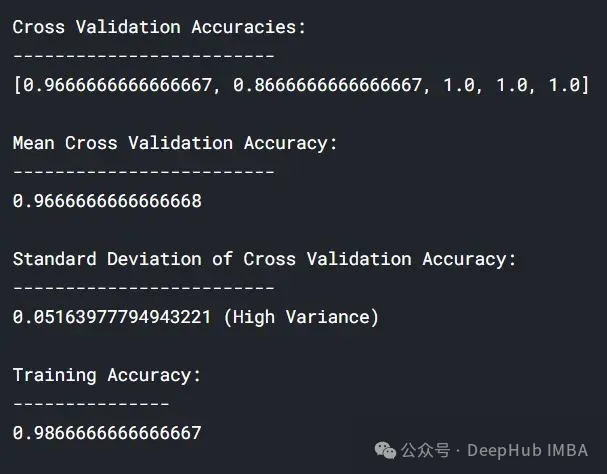
lc = learn_curve(X,y,1/10000) print(f'Cross Validation Accuracies:\n{"-"*25}\n{list(lc["cv_scores"])}\n\n\ Mean Cross Validation Accuracy:\n{"-"*25}\n{np.mean(lc["cv_scores"])}\n\n\ Standard Deviation of Cross Validation Accuracy:\n{"-"*25}\n{np.std(lc["cv_scores"])} (Low variance)\n\n\ Training Deep HUB Accuracy:\n{"-"*15}\n{lc["train_score"]}\n\n') sns.lineplot(data=lc["learning_curve"],x="Training_size",y="value",hue="variable") plt.title("Learning Curve of an Underfit Model") plt.ylabel("Misclassification Rate/Loss");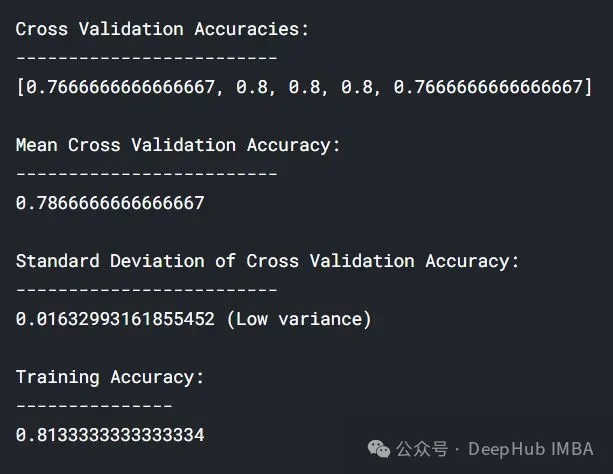
使用正则化技术(如L1、L2正则化)。
减少模型的复杂性,比如减少参数数量、层数或特征数量。
增加更多的训练数据。
应用数据增强技术。
使用早停(early stopping)等技术来避免过度训练。
以上是透過學習曲線辨識過擬合和欠擬合的詳細內容。更多資訊請關注PHP中文網其他相關文章!

熱AI工具

Undresser.AI Undress
人工智慧驅動的應用程序,用於創建逼真的裸體照片

AI Clothes Remover
用於從照片中去除衣服的線上人工智慧工具。

Undress AI Tool
免費脫衣圖片

Clothoff.io
AI脫衣器

AI Hentai Generator
免費產生 AI 無盡。

熱門文章

熱工具

記事本++7.3.1
好用且免費的程式碼編輯器

SublimeText3漢化版
中文版,非常好用

禪工作室 13.0.1
強大的PHP整合開發環境

Dreamweaver CS6
視覺化網頁開發工具

SublimeText3 Mac版
神級程式碼編輯軟體(SublimeText3)

熱門話題
 位元組跳動剪映推出 SVIP 超級會員:連續包年 499 元,提供多種 AI 功能
Jun 28, 2024 am 03:51 AM
本站6月27日訊息,剪映是由位元組跳動旗下臉萌科技開發的一款影片剪輯軟體,依託於抖音平台且基本面向該平台用戶製作短影片內容,並相容於iOS、安卓、Windows 、MacOS等作業系統。剪映官方宣布會員體系升級,推出全新SVIP,包含多種AI黑科技,例如智慧翻譯、智慧劃重點、智慧包裝、數位人合成等。價格方面,剪映SVIP月費79元,年費599元(本站註:折合每月49.9元),連續包月則為59元每月,連續包年為499元每年(折合每月41.6元) 。此外,剪映官方也表示,為提升用戶體驗,向已訂閱了原版VIP
 使用Rag和Sem-Rag提供上下文增強AI編碼助手
Jun 10, 2024 am 11:08 AM
透過將檢索增強生成和語意記憶納入AI編碼助手,提升開發人員的生產力、效率和準確性。譯自EnhancingAICodingAssistantswithContextUsingRAGandSEM-RAG,作者JanakiramMSV。雖然基本AI程式設計助理自然有幫助,但由於依賴對軟體語言和編寫軟體最常見模式的整體理解,因此常常無法提供最相關和正確的程式碼建議。這些編碼助手產生的代碼適合解決他們負責解決的問題,但通常不符合各個團隊的編碼標準、慣例和風格。這通常會導致需要修改或完善其建議,以便將程式碼接受到應
 微調真的能讓LLM學到新東西嗎:引入新知識可能讓模型產生更多的幻覺
Jun 11, 2024 pm 03:57 PM
大型語言模型(LLM)是在龐大的文字資料庫上訓練的,在那裡它們獲得了大量的實際知識。這些知識嵌入到它們的參數中,然後可以在需要時使用。這些模型的知識在訓練結束時被「具體化」。在預訓練結束時,模型實際上停止學習。對模型進行對齊或進行指令調優,讓模型學習如何充分利用這些知識,以及如何更自然地回應使用者的問題。但是有時模型知識是不夠的,儘管模型可以透過RAG存取外部內容,但透過微調使用模型適應新的領域被認為是有益的。這種微調是使用人工標註者或其他llm創建的輸入進行的,模型會遇到額外的實際知識並將其整合
 七個很酷的GenAI & LLM技術性面試問題
Jun 07, 2024 am 10:06 AM
想了解更多AIGC的內容,請造訪:51CTOAI.x社群https://www.51cto.com/aigc/譯者|晶顏審校|重樓不同於網路上隨處可見的傳統問題庫,這些問題需要跳脫常規思維。大語言模型(LLM)在數據科學、生成式人工智慧(GenAI)和人工智慧領域越來越重要。這些複雜的演算法提升了人類的技能,並在許多產業中推動了效率和創新性的提升,成為企業保持競爭力的關鍵。 LLM的應用範圍非常廣泛,它可以用於自然語言處理、文字生成、語音辨識和推薦系統等領域。透過學習大量的數據,LLM能夠產生文本
 為大模型提供全新科學複雜問答基準與評估體系,UNSW、阿貢、芝加哥大學等多家機構共同推出SciQAG框架
Jul 25, 2024 am 06:42 AM
編輯|ScienceAI問答(QA)資料集在推動自然語言處理(NLP)研究中發揮著至關重要的作用。高品質QA資料集不僅可以用於微調模型,也可以有效評估大語言模型(LLM)的能力,尤其是針對科學知識的理解和推理能力。儘管目前已有許多科學QA數據集,涵蓋了醫學、化學、生物等領域,但這些數據集仍有一些不足之處。其一,資料形式較為單一,大多數為多項選擇題(multiple-choicequestions),它們易於進行評估,但限制了模型的答案選擇範圍,無法充分測試模型的科學問題解答能力。相比之下,開放式問答
 你所不知道的機器學習五大學派
Jun 05, 2024 pm 08:51 PM
機器學習是人工智慧的重要分支,它賦予電腦從數據中學習的能力,並能夠在無需明確編程的情況下改進自身能力。機器學習在各個領域都有廣泛的應用,從影像辨識和自然語言處理到推薦系統和詐欺偵測,它正在改變我們的生活方式。機器學習領域存在著多種不同的方法和理論,其中最具影響力的五種方法被稱為「機器學習五大派」。這五大派分別為符號派、聯結派、進化派、貝葉斯派和類推學派。 1.符號學派符號學(Symbolism),又稱符號主義,強調利用符號進行邏輯推理和表達知識。該學派認為學習是一種逆向演繹的過程,透過現有的
 SOTA性能,廈大多模態蛋白質-配體親和力預測AI方法,首次結合分子表面訊息
Jul 17, 2024 pm 06:37 PM
編輯|KX在藥物研發領域,準確有效地預測蛋白質與配體的結合親和力對於藥物篩選和優化至關重要。然而,目前的研究並沒有考慮到分子表面訊息在蛋白質-配體相互作用中的重要作用。基於此,來自廈門大學的研究人員提出了一種新穎的多模態特徵提取(MFE)框架,該框架首次結合了蛋白質表面、3D結構和序列的信息,並使用交叉注意機制進行不同模態之間的特徵對齊。實驗結果表明,該方法在預測蛋白質-配體結合親和力方面取得了最先進的性能。此外,消融研究證明了該框架內蛋白質表面資訊和多模態特徵對齊的有效性和必要性。相關研究以「S
 佈局 AI 等市場,格芯收購泰戈爾科技氮化鎵技術和相關團隊
Jul 15, 2024 pm 12:21 PM
本站7月5日消息,格芯(GlobalFoundries)於今年7月1日發布新聞稿,宣布收購泰戈爾科技(TagoreTechnology)的功率氮化鎵(GaN)技術及智慧財產權組合,希望在汽車、物聯網和人工智慧資料中心應用領域探索更高的效率和更好的效能。隨著生成式人工智慧(GenerativeAI)等技術在數位世界的不斷發展,氮化鎵(GaN)已成為永續高效電源管理(尤其是在資料中心)的關鍵解決方案。本站引述官方公告內容,在本次收購過程中,泰戈爾科技公司工程師團隊將加入格芯,進一步開發氮化鎵技術。 G


