

AdaBoost - 集成方法,分类:监督机器学习

提升
定义和目的
Boosting 是机器学习中用于提高模型准确性的集成学习技术。它结合了多个弱分类器(性能比随机猜测稍好的模型)来创建强分类器。 boosting的主要目的是依次将弱分类器应用到数据上,纠正先前分类器所犯的错误,从而提高整体性能。
主要目标:
- 提高准确率:通过组合多个弱分类器的输出来提高预测准确率。
- 减少偏差和方差:解决偏差和方差问题,以实现模型更好的泛化。
- 处理复杂数据:有效地建模数据中的复杂关系。
AdaBoost(自适应增强)
定义和目的
AdaBoost,Adaptive Boosting 的缩写,是一种流行的 boosting 算法。它调整错误分类实例的权重,以便后续分类器更加关注困难的案例。 AdaBoost 的主要目的是通过在每次迭代中强调难以分类的示例来提高弱分类器的性能。
主要目标:
- 权重调整:增加错误分类实例的权重,以确保下一个分类器重点关注它们。
- 顺序学习:顺序构建分类器,每个新分类器都会纠正其前一个分类器的错误。
- 性能提升:将弱分类器组合起来形成具有更好预测能力的强分类器。
AdaBoost 的工作原理
-
初始化权重:
- 为所有训练实例分配相同的权重。对于包含 n 个实例的数据集,每个实例的权重为 1/n。
-
训练弱分类器:
- 使用加权数据集训练弱分类器。
-
计算分类器错误:
- 计算弱分类器的误差,即错误分类实例的权重之和。
-
计算分类器权重:
- 根据分类器的误差计算其权重。重量由下式给出: 阿尔法 = 0.5 * log((1 - 误差) / 误差)
- 较低的错误导致较高的分类器权重。
-
更新实例的权重:
- 调整实例的权重。增加错误分类实例的权重,减少正确分类实例的权重。
- 实例 i 的更新权重为: 权重[i] = 权重[i] * exp(alpha * (错误分类? 1 : -1))
- 标准化权重以确保它们的总和为 1。
-
组合弱分类器:
- 最终的强分类器是弱分类器的加权和: 最终分类器=符号(sum(alpha *weak_classifier))
- sign 函数根据总和确定类标签。
AdaBoost(二元分类)示例
AdaBoost 是 Adaptive Boosting 的缩写,是一种结合多个弱分类器来创建强分类器的集成技术。此示例演示如何使用合成数据实现 AdaBoost 进行二元分类、评估模型的性能以及可视化决策边界。
Python 代码示例
1。导入库
import numpy as np
import matplotlib.pyplot as plt
from sklearn.model_selection import train_test_split
from sklearn.ensemble import AdaBoostClassifier
from sklearn.tree import DecisionTreeClassifier
from sklearn.metrics import accuracy_score, confusion_matrix, classification_report
此块导入数据操作、绘图和机器学习所需的库。
2。生成样本数据
np.random.seed(42)  # For reproducibility

# Generate synthetic data for 2 classes
n_samples = 1000
n_samples_per_class = n_samples // 2

# Class 0: Centered around (-1, -1)
X0 = np.random.randn(n_samples_per_class, 2) * 0.7 + [-1, -1]

# Class 1: Centered around (1, 1)
X1 = np.random.randn(n_samples_per_class, 2) * 0.7 + [1, 1]

# Combine the data
X = np.vstack([X0, X1])
y = np.hstack([np.zeros(n_samples_per_class), np.ones(n_samples_per_class)])

# Shuffle the dataset
shuffle_idx = np.random.permutation(n_samples)
X, y = X[shuffle_idx], y[shuffle_idx]
该块生成具有两个特征的合成数据,其中目标变量 y 是基于类中心定义的,模拟二元分类场景。
3。分割数据集
X_train, X_test, y_train, y_test = train_test_split(X, y, test_size=0.2, random_state=42)
此块将数据集拆分为训练集和测试集以进行模型评估。
4。创建并训练 AdaBoost 分类器
base_estimator = DecisionTreeClassifier(max_depth=1)  # Decision stump
model = AdaBoostClassifier(estimator=base_estimator, n_estimators=3, random_state=42)
model.fit(X_train, y_train)
此块使用决策树桩作为基本估计器来初始化 AdaBoost 模型,并使用训练数据集对其进行训练。
5。做出预测
y_pred = model.predict(X_test)
此块使用经过训练的模型对测试集进行预测。
6。评估模型
accuracy = accuracy_score(y_test, y_pred)
conf_matrix = confusion_matrix(y_test, y_pred)
class_report = classification_report(y_test, y_pred)

print(f"Accuracy: {accuracy:.4f}")
print("\nConfusion Matrix:")
print(conf_matrix)
print("\nClassification Report:")
print(class_report)
输出:
Accuracy: 0.9400

Confusion Matrix:
[[96  8]
 [ 4 92]]

Classification Report:
              precision    recall  f1-score   support

         0.0       0.96      0.92      0.94       104
         1.0       0.92      0.96      0.94        96

    accuracy                           0.94       200
   macro avg       0.94      0.94      0.94       200
weighted avg       0.94      0.94      0.94       200
此块计算并打印准确性、混淆矩阵和分类报告,提供对模型性能的深入了解。
7。可视化决策边界
x_min, x_max = X[:, 0].min() - 1, X[:, 0].max() + 1
y_min, y_max = X[:, 1].min() - 1, X[:, 1].max() + 1
xx, yy = np.meshgrid(np.arange(x_min, x_max, 0.1),
                     np.arange(y_min, y_max, 0.1))
Z = model.predict(np.c_[xx.ravel(), yy.ravel()])
Z = Z.reshape(xx.shape)

plt.figure(figsize=(10, 8))
plt.contourf(xx, yy, Z, alpha=0.4, cmap='RdYlBu')
scatter = plt.scatter(X[:, 0], X[:, 1], c=y, cmap='RdYlBu', edgecolor='black')
plt.xlabel("Feature 1")
plt.ylabel("Feature 2")
plt.title("AdaBoost Binary Classification")
plt.colorbar(scatter)
plt.show()
This block visualizes the decision boundary created by the AdaBoost model, illustrating how the model separates the two classes in the feature space.
Output:

This structured approach demonstrates how to implement and evaluate AdaBoost for binary classification tasks, providing a clear understanding of its capabilities. The visualization of the decision boundary aids in interpreting the model's predictions.
AdaBoost (Multiclass Classification) Example
AdaBoost is an ensemble learning technique that combines multiple weak classifiers to create a strong classifier. This example demonstrates how to implement AdaBoost for multiclass classification using synthetic data, evaluate the model's performance, and visualize the decision boundary for five classes.
Python Code Example
1. Import Libraries
import numpy as np
import matplotlib.pyplot as plt
from sklearn.model_selection import train_test_split
from sklearn.ensemble import AdaBoostClassifier
from sklearn.tree import DecisionTreeClassifier
from sklearn.metrics import accuracy_score, confusion_matrix, classification_report
This block imports the necessary libraries for data manipulation, plotting, and machine learning.
2. Generate Sample Data with 5 Classes
np.random.seed(42)  # For reproducibility
n_samples = 2500  # Total number of samples
n_samples_per_class = n_samples // 5  # Ensure this is exactly n_samples // 5

# Class 0: Centered around (-2, -2)
X0 = np.random.randn(n_samples_per_class, 2) * 0.5 + [-2, -2]

# Class 1: Centered around (0, -2)
X1 = np.random.randn(n_samples_per_class, 2) * 0.5 + [0, -2]

# Class 2: Centered around (2, -2)
X2 = np.random.randn(n_samples_per_class, 2) * 0.5 + [2, -2]

# Class 3: Centered around (-1, 2)
X3 = np.random.randn(n_samples_per_class, 2) * 0.5 + [-1, 2]

# Class 4: Centered around (1, 2)
X4 = np.random.randn(n_samples_per_class, 2) * 0.5 + [1, 2]

# Combine the data
X = np.vstack([X0, X1, X2, X3, X4])
y = np.hstack([np.zeros(n_samples_per_class),
               np.ones(n_samples_per_class),
               np.full(n_samples_per_class, 2),
               np.full(n_samples_per_class, 3),
               np.full(n_samples_per_class, 4)])

# Shuffle the dataset
shuffle_idx = np.random.permutation(n_samples)
X, y = X[shuffle_idx], y[shuffle_idx]
This block generates synthetic data for five classes located in different regions of the feature space.
3. Split the Dataset
X_train, X_test, y_train, y_test = train_test_split(X, y, test_size=0.2, random_state=42)
This block splits the dataset into training and testing sets for model evaluation.
4. Create and Train the AdaBoost Classifier
base_estimator = DecisionTreeClassifier(max_depth=1)  # Decision stump
model = AdaBoostClassifier(estimator=base_estimator, n_estimators=10, random_state=42)
model.fit(X_train, y_train)
This block initializes the AdaBoost classifier with a weak learner (decision stump) and trains it using the training dataset.
5. Make Predictions
y_pred = model.predict(X_test)
This block uses the trained model to make predictions on the test set.
6. Evaluate the Model
accuracy = accuracy_score(y_test, y_pred)
conf_matrix = confusion_matrix(y_test, y_pred)
class_report = classification_report(y_test, y_pred)

print(f"Accuracy: {accuracy:.4f}")
print("\nConfusion Matrix:")
print(conf_matrix)
print("\nClassification Report:")
print(class_report)
Output:
Accuracy: 0.9540

Confusion Matrix:
[[ 97   2   0   0   0]
 [  0  92   3   0   0]
 [  0   4  92   0   0]
 [  0   0   0  86  14]
 [  0   0   0   0 110]]

Classification Report:
              precision    recall  f1-score   support

         0.0       1.00      0.98      0.99        99
         1.0       0.94      0.97      0.95        95
         2.0       0.97      0.96      0.96        96
         3.0       1.00      0.86      0.92       100
         4.0       0.89      1.00      0.94       110

    accuracy                           0.95       500
   macro avg       0.96      0.95      0.95       500
weighted avg       0.96      0.95      0.95       500
This block calculates and prints the accuracy, confusion matrix, and classification report, providing insights into the model's performance.
7. Visualize the Decision Boundary
x_min, x_max = X[:, 0].min() - 1, X[:, 0].max() + 1
y_min, y_max = X[:, 1].min() - 1, X[:, 1].max() + 1
xx, yy = np.meshgrid(np.arange(x_min, x_max, 0.1),
                     np.arange(y_min, y_max, 0.1))
Z = model.predict(np.c_[xx.ravel(), yy.ravel()])
Z = Z.reshape(xx.shape)

plt.figure(figsize=(12, 10))
plt.contourf(xx, yy, Z, alpha=0.4, cmap='viridis')
scatter = plt.scatter(X[:, 0], X[:, 1], c=y, cmap='viridis', edgecolor='black')
plt.xlabel("Feature 1")
plt.ylabel("Feature 2")
plt.title("AdaBoost Multiclass Classification (5 Classes)")
plt.colorbar(scatter)
plt.show()
This block visualizes the decision boundaries created by the AdaBoost classifier, illustrating how the model separates the five classes in the feature space.
Output:
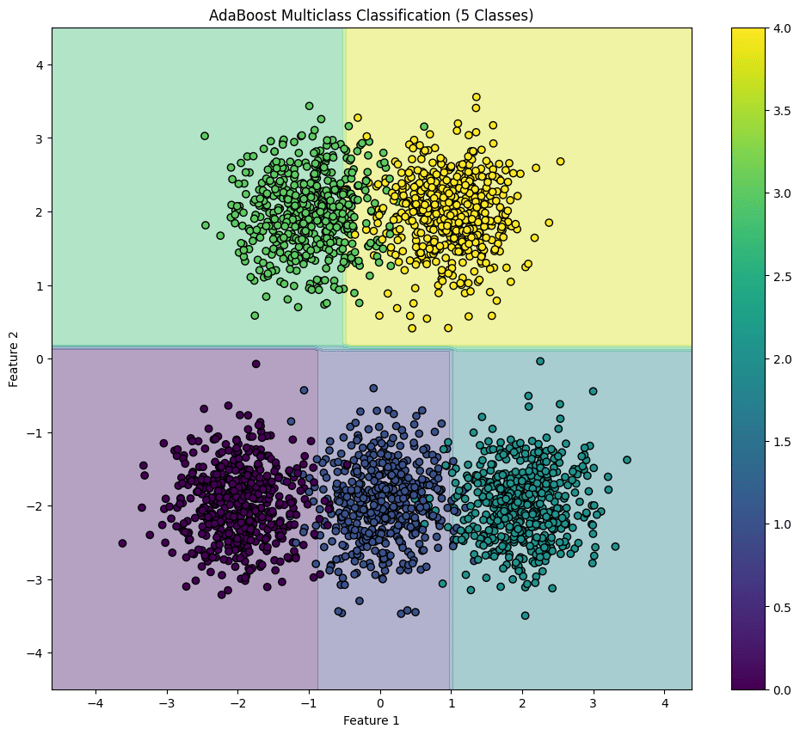
This structured approach demonstrates how to implement and evaluate AdaBoost for multiclass classification tasks, providing a clear understanding of its capabilities and the effectiveness of visualizing decision boundaries.
以上是AdaBoost - 集成方法,分类:监督机器学习的详细内容。更多信息请关注PHP中文网其他相关文章!

热AI工具

Undresser.AI Undress
人工智能驱动的应用程序,用于创建逼真的裸体照片

AI Clothes Remover
用于从照片中去除衣服的在线人工智能工具。

Undress AI Tool
免费脱衣服图片

Clothoff.io
AI脱衣机

Video Face Swap
使用我们完全免费的人工智能换脸工具轻松在任何视频中换脸!

热门文章
热工具

记事本++7.3.1
好用且免费的代码编辑器

SublimeText3汉化版
中文版,非常好用

禅工作室 13.0.1
功能强大的PHP集成开发环境

Dreamweaver CS6
视觉化网页开发工具

SublimeText3 Mac版
神级代码编辑软件(SublimeText3)


 Python与C:学习曲线和易用性
Apr 19, 2025 am 12:20 AM
Python与C:学习曲线和易用性
Apr 19, 2025 am 12:20 AM
Python更易学且易用,C 则更强大但复杂。1.Python语法简洁,适合初学者,动态类型和自动内存管理使其易用,但可能导致运行时错误。2.C 提供低级控制和高级特性,适合高性能应用,但学习门槛高,需手动管理内存和类型安全。
 学习Python:2小时的每日学习是否足够?
Apr 18, 2025 am 12:22 AM
学习Python:2小时的每日学习是否足够?
Apr 18, 2025 am 12:22 AM
每天学习Python两个小时是否足够?这取决于你的目标和学习方法。1)制定清晰的学习计划,2)选择合适的学习资源和方法,3)动手实践和复习巩固,可以在这段时间内逐步掌握Python的基本知识和高级功能。
 Python vs.C:探索性能和效率
Apr 18, 2025 am 12:20 AM
Python vs.C:探索性能和效率
Apr 18, 2025 am 12:20 AM
Python在开发效率上优于C ,但C 在执行性能上更高。1.Python的简洁语法和丰富库提高开发效率。2.C 的编译型特性和硬件控制提升执行性能。选择时需根据项目需求权衡开发速度与执行效率。
 Python vs. C:了解关键差异
Apr 21, 2025 am 12:18 AM
Python vs. C:了解关键差异
Apr 21, 2025 am 12:18 AM
Python和C 各有优势,选择应基于项目需求。1)Python适合快速开发和数据处理,因其简洁语法和动态类型。2)C 适用于高性能和系统编程,因其静态类型和手动内存管理。
 Python标准库的哪一部分是:列表或数组?
Apr 27, 2025 am 12:03 AM
Python标准库的哪一部分是:列表或数组?
Apr 27, 2025 am 12:03 AM
pythonlistsarepartofthestAndArdLibrary,herilearRaysarenot.listsarebuilt-In,多功能,和Rused ForStoringCollections,而EasaraySaraySaraySaraysaraySaraySaraysaraySaraysarrayModuleandleandleandlesscommonlyusedDduetolimitedFunctionalityFunctionalityFunctionality。
 Python:自动化,脚本和任务管理
Apr 16, 2025 am 12:14 AM
Python:自动化,脚本和任务管理
Apr 16, 2025 am 12:14 AM
Python在自动化、脚本编写和任务管理中表现出色。1)自动化:通过标准库如os、shutil实现文件备份。2)脚本编写:使用psutil库监控系统资源。3)任务管理:利用schedule库调度任务。Python的易用性和丰富库支持使其在这些领域中成为首选工具。
 科学计算的Python:详细的外观
Apr 19, 2025 am 12:15 AM
科学计算的Python:详细的外观
Apr 19, 2025 am 12:15 AM
Python在科学计算中的应用包括数据分析、机器学习、数值模拟和可视化。1.Numpy提供高效的多维数组和数学函数。2.SciPy扩展Numpy功能,提供优化和线性代数工具。3.Pandas用于数据处理和分析。4.Matplotlib用于生成各种图表和可视化结果。
 Web开发的Python:关键应用程序
Apr 18, 2025 am 12:20 AM
Web开发的Python:关键应用程序
Apr 18, 2025 am 12:20 AM
Python在Web开发中的关键应用包括使用Django和Flask框架、API开发、数据分析与可视化、机器学习与AI、以及性能优化。1.Django和Flask框架:Django适合快速开发复杂应用,Flask适用于小型或高度自定义项目。2.API开发:使用Flask或DjangoRESTFramework构建RESTfulAPI。3.数据分析与可视化:利用Python处理数据并通过Web界面展示。4.机器学习与AI:Python用于构建智能Web应用。5.性能优化:通过异步编程、缓存和代码优
