
为了直观地显示图形,必须为每个顶点分配一个位置。上一节介绍了如何使用 Graph 接口、AbstractGraph 类和 UnweightedGraph 类对图进行建模。本节讨论如何以图形方式显示图表。为了显示图形,您需要知道每个顶点的显示位置以及每个顶点的名称。为了确保图形可以显示,我们定义了一个名为 Displayable 的接口,它具有获取 x- 和 y- 坐标及其名称的方法,以及在下面的代码中使可显示的顶点实例。

具有 可显示 顶点的图形现在可以显示在名为 GraphView 的窗格上,如下面的代码所示。

要在窗格上显示图形,只需通过将图形作为构造函数中的参数传递来创建 GraphView 的实例(第 9 行)。图的顶点类必须实现 Displayable 接口才能显示顶点(第 13-22 行)。对于每个顶点索引 i,调用 graph.getNeighbors(i) 返回其邻接列表(第 26 行)。从此列表中,您可以找到与 i 相邻的所有顶点,并绘制一条线将 i 与其相邻顶点连接起来(第 27-34 行)。
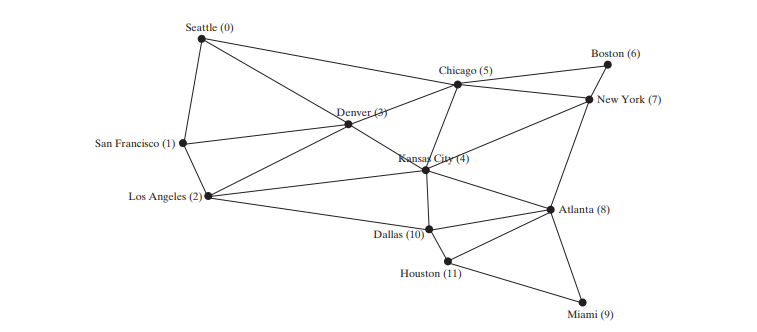
下面的代码给出了显示上图图形的示例,如下图所示。

import javafx.application.Application;
import javafx.scene.Scene;
import javafx.stage.Stage;

public class DisplayUSMap extends Application {
    @Override // Override the start method in the Application class
    public void start(Stage primaryStage) {
        City[] vertices = {new City("Seattle", 75, 50),
                new City("San Francisco", 50, 210),
                new City("Los Angeles", 75, 275), new City("Denver", 275, 175),
                new City("Kansas City", 400, 245),
                new City("Chicago", 450, 100), new City("Boston", 700, 80),
                new City("New York", 675, 120), new City("Atlanta", 575, 295),
                new City("Miami", 600, 400), new City("Dallas", 408, 325),
                new City("Houston", 450, 360)};

        // Edge array for graph
        int[][] edges = {
                {0, 1}, {0, 3}, {0, 5}, {1, 0}, {1, 2}, {1, 3},
                {2, 1}, {2, 3}, {2, 4}, {2, 10},
                {3, 0}, {3, 1}, {3, 2}, {3, 4}, {3, 5},
                {4, 2}, {4, 3}, {4, 5}, {4, 7}, {4, 8}, {4, 10},
                {5, 0}, {5, 3}, {5, 4}, {5, 6}, {5, 7},
                {6, 5}, {6, 7}, {7, 4}, {7, 5}, {7, 6}, {7, 8},
                {8, 4}, {8, 7}, {8, 9}, {8, 10}, {8, 11},
                {9, 8}, {9, 11}, {10, 2}, {10, 4}, {10, 8}, {10, 11},
                {11, 8}, {11, 9}, {11, 10}
        };

        Graph<City> graph = new UnweightedGraph<>(vertices, edges);

        // Create a scene and place it in the stage
        Scene scene = new Scene(new GraphView(graph), 750, 450);
        primaryStage.setTitle("DisplayUSMap"); // Set the stage title
        primaryStage.setScene(scene); // Place the scene in the stage
        primaryStage.show(); // Display the stage
    }

    public static void main(String[] args) {
        Application.launch(args);
    }

    static class City implements Displayable {
        private int x, y;
        private String name;

        City(String name, int x, int y) {
            this.name = name;
            this.x = x;
            this.y = y;
        }

        @Override
        public int getX() {
            return x;
        }

        @Override
        public int getY() {
            return y;
        }

        @Override
        public String getName() {
            return name;
        }
    }
}
类 City 被定义为用坐标和名称对顶点建模(第 39-63 行)。该程序使用 City 类型的顶点创建一个图(第 30 行)。由于 City 实现了 Displayable,因此为图表创建的 GraphView 对象会在窗格中显示图表(第 33 行)。
以上是图形可视化的详细内容。更多信息请关注PHP中文网其他相关文章!


