

使用 AppSignal 监控 Python Django 应用程序的性能

当我们观察到缓慢的系统时,我们的第一直觉可能是将其标记为失败。这种假设很普遍,并强调了一个基本事实:性能是应用程序的成熟度和生产准备程度的代名词。
在 Web 应用程序中,毫秒可以决定用户交互的成功或失败,因此风险非常高。性能不仅仅是技术标杆,更是用户满意度和运营效率的基石。
性能封装了系统在不同工作负载下的响应能力,通过 CPU 和内存利用率、响应时间、可扩展性和吞吐量等指标进行量化。
在本文中,我们将探讨 AppSignal 如何监控和增强 Django 应用程序的性能。
让我们开始吧!
Django 性能监控要点
在 Django 应用程序中实现最佳性能涉及多方面的方法。这意味着开发能够高效运行并在扩展时保持效率的应用程序。关键指标在此过程中至关重要,可以提供切实的数据来指导我们的优化工作。让我们探讨其中一些指标。
性能监控的关键指标
- 响应时间:这也许是用户体验最直接的指标。它测量处理用户请求和发回响应所花费的时间。在 Django 应用程序中,数据库查询、视图处理和中间件操作等因素会影响响应时间。
- 吞吐量:吞吐量是指您的应用程序在给定时间范围内可以处理的请求数量。
- 错误率:错误(4xx 和 5xx HTTP 响应)的频率可以指示代码、数据库查询或服务器配置问题。通过监控错误率,您可以快速识别并修复可能会降低用户体验的问题。
- 数据库性能指标:其中包括每个请求的查询数量、查询执行时间和数据库连接的效率。
- 处理并发用户:当多个用户同时访问您的 Django 应用程序时,能够高效且无延迟地为所有用户提供服务至关重要。
我们将建造什么
在本文中,我们将构建一个基于 Django 的电子商务商店,为高流量事件做好准备,集成 AppSignal 来监控、优化并确保其在负载下无缝扩展。我们还将演示如何使用 AppSignal 增强现有应用程序以提高性能(在本例中为 Open edX 学习管理系统)。
项目设置
先决条件
要继续操作,您需要:
- Python 3.12.2
- 支持 AppSignal 的操作系统
- AppSignal 帐户
- Django 基础知识
准备项目
现在让我们为我们的项目创建一个目录并从 GitHub 克隆它。我们将安装所有要求并运行迁移:
mkdir django-performance && cd django-performance
python3.12 -m venv venv
source venv/bin/activate
git clone -b main https://github.com/amirtds/mystore
cd mystore
python3.12 -m pip install -r requirements.txt
python3.12 manage.py migrate
python3.12 manage.py runserver
现在访问 127.0.0.1:8000。您应该看到类似这样的内容:
这个 Django 应用程序是一个简单的电子商务商店,为用户提供产品列表、详细信息和结帐页面。成功克隆并安装应用程序后,使用 Django createsuperuser 管理命令创建超级用户。
现在让我们在应用程序中创建几个产品。首先,我们将通过运行以下命令进入 Django 应用程序:
python3.12 manage.py shell
创建 3 个类别和 3 个产品:
from store.models import Category, Product

# Create categories
electronics = Category(name='Electronics', description='Gadgets and electronic devices.')
books = Category(name='Books', description='Read the world.')
clothing = Category(name='Clothing', description='Latest fashion and trends.')

# Save categories to the database
electronics.save()
books.save()
clothing.save()

# Now let's create new Products with slugs and image URLs
Product.objects.create(
    category=electronics,
    name='Smartphone',
    description='Latest model with high-end specs.',
    price=799.99,
    stock=30,
    available=True,
    slug='smartphone',
    image='products/iphone_14_pro_max.png'
)

Product.objects.create(
    category=books,
    name='Python Programming',
    description='Learn Python programming with this comprehensive guide.',
    price=39.99,
    stock=50,
    available=True,
    slug='python-programming',
    image='products/python_programming_book.png'
)

Product.objects.create(
    category=clothing,
    name='Jeans',
    description='Comfortable and stylish jeans for everyday wear.',
    price=49.99,
    stock=20,
    available=True,
    slug='jeans',
    image='products/jeans.png'
)
现在关闭 shell 并运行服务器。您应该看到类似以下内容:

安装应用信号
我们将在我们的项目中安装 AppSignal 和 opentelemetry-instrumentation-django。
在安装这些软件包之前,请使用您的凭据登录 AppSignal(您可以注册 30 天免费试用)。选择组织后,点击导航栏右上角的添加应用。选择 Python 作为您的语言,您将收到一个push-api-key。
确保您的虚拟环境已激活并运行以下命令:
python3.12 -m pip install appsignal==1.2.1
python3.12 -m appsignal install --push-api-key [YOU-KEY]
python3.12 -m pip install opentelemetry-instrumentation-django==0.45b0
在 CLI 提示中提供应用程序名称。安装后,您应该在项目中看到一个名为 __appsignal__.py 的新文件。
Now let's create a new file called .env in the project root and add APPSIGNAL_PUSH_API_KEY=YOUR-KEY (remember to change the value to your actual key). Then, let's change the content of the __appsignal__.py file to the following:
# __appsignal__.py
import os
from appsignal import Appsignal

# Load environment variables from the .env file
from dotenv import load_dotenv
load_dotenv()

# Get APPSIGNAL_PUSH_API_KEY from environment
push_api_key = os.getenv('APPSIGNAL_PUSH_API_KEY')

appsignal = Appsignal(
    active=True,
    name="mystore",
    push_api_key=os.getenv("APPSIGNAL_PUSH_API_KEY"),
)
Next, update the manage.py file to read like this:
# manage.py
#!/usr/bin/env python
"""Django's command-line utility for administrative tasks."""
import os
import sys

# import appsignal
from __appsignal__ import appsignal # new line


def main():
    """Run administrative tasks."""
    os.environ.setdefault("DJANGO_SETTINGS_MODULE", "mystore.settings")

    # Start Appsignal
    appsignal.start() # new line

    try:
        from django.core.management import execute_from_command_line
    except ImportError as exc:
        raise ImportError(
            "Couldn't import Django. Are you sure it's installed and "
            "available on your PYTHONPATH environment variable? Did you "
            "forget to activate a virtual environment?"
        ) from exc
    execute_from_command_line(sys.argv)


if __name__ == "__main__":
    main()
We've imported AppSignal and started it using the configuration from __appsignal.py.
Please note that the changes we made to manage.py are for a development environment. In production, we should change wsgi.py or asgi.py. For more information, visit AppSignal's Django documentation.
Project Scenario: Optimizing for a New Year Sale and Monitoring Concurrent Users
As we approach the New Year sales on our Django-based e-commerce platform, we recall last year's challenges: increased traffic led to slow load times and even some downtime. This year, we aim to avoid these issues by thoroughly testing and optimizing our site beforehand. We'll use Locust to simulate user traffic and AppSignal to monitor our application's performance.
Creating a Locust Test for Simulated Traffic
First, we'll create a locustfile.py file that simulates simultaneous users navigating through critical parts of our site: the homepage, a product detail page, and the checkout page. This simulation helps us understand how our site performs under pressure.
Create the locustfile.py in the project root:
# locustfile.py
from locust import HttpUser, between, task

class WebsiteUser(HttpUser):
    wait_time = between(1, 3)  # Users wait 1-3 seconds between tasks

    @task
    def index_page(self):
        self.client.get("/store/")

    @task(3)
    def view_product_detail(self):
        self.client.get("/store/product/smartphone/")

    @task(2)
    def view_checkout_page(self):
        self.client.get("/store/checkout/smartphone/")
In locustfile.py, users primarily visit the product detail page, followed by the checkout page, and occasionally return to the homepage. This pattern aims to mimic realistic user behavior during a sale.
Before running Locust, ensure you have a product with the smartphone slug in the Django app. If you don't, go to /admin/store/product/ and create one.
Defining Acceptable Response Times
Before we start, let's define what we consider an acceptable response time. For a smooth user experience, we aim for:
- Homepage and product detail pages: under 1 second.
- Checkout page: under 1.5 seconds (due to typically higher complexity).
These targets ensure users experience minimal delay, keeping their engagement high.
Conducting the Test and Monitoring Results
With our Locust test ready, we run it to simulate the 500 users and observe the results in real time. Here's how:
- Start the Locust test by running locust -f locustfile.py in your terminal, then open http://localhost:8089 to set up and start the simulation. Set the Number of Users to 500 and set the host to http://127.0.0.1:8000
- Monitor performance in both Locust's web interface and AppSignal. Locust shows us request rates and response times, while AppSignal provides deeper insights into our Django app's behavior under load.
After running Locust, you can find information about the load test in its dashboard:

Now, go to your application page in AppSignal. Under the Performance section, click on Actions and you should see something like this:
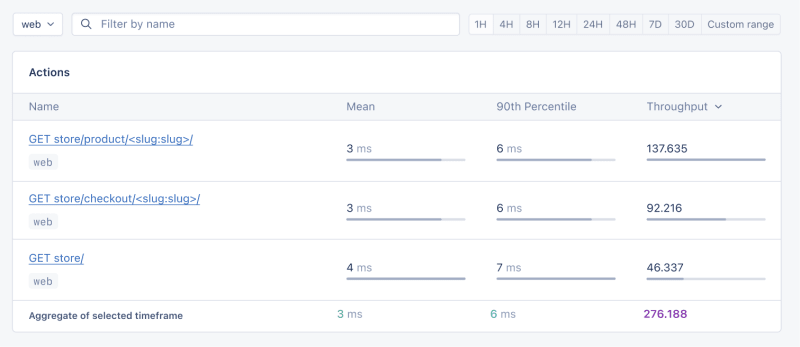
- Mean: This is the average response time for all the requests made to a particular endpoint. It provides a general idea of how long it takes for the server to respond. In our context, any mean response time greater than 1 second could be considered a red flag, indicating that our application's performance might not meet user expectations for speed.
- 90th Percentile: This is the response time at the 90th percentile. For example, for GET store/, we have 7 ms, which means 90% of requests are completed in 7 ms or less.
- Throughput: The number of requests handled per second.
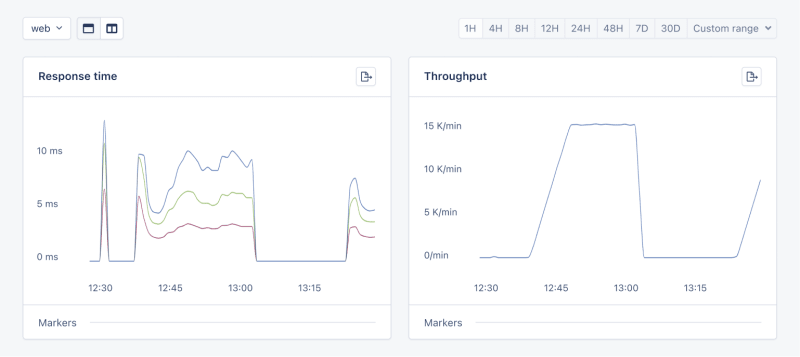
Now let's click on the Graphs under Performance:
We need to prepare our site for the New Year sales, as response times might exceed our targets. Here's a simplified plan:
- Database Queries: Slow queries often cause performance issues.
- Static Assets: Ensure static assets are properly cached. Use a CDN for better delivery speeds.
- Application Resources: Sometimes, the solution is as straightforward as adding more RAM and CPUs.
Database Operations
Understanding Database Performance Impact
When it comes to web applications, one of the most common sources of slow performance is database queries. Every time a user performs an action that requires data retrieval or manipulation, a query is made to the database.
If these queries are not well-optimized, they can take a considerable amount of time to execute, leading to a sluggish user experience. That's why it's crucial to monitor and optimize our queries, ensuring they're efficient and don't become the bottleneck in our application's performance.
Instrumentation and Spans
Before diving into the implementation, let's clarify two key concepts in performance monitoring:
- Instrumentation
- Spans
Instrumentation is the process of augmenting code to measure its performance and behavior during execution. Think of it like fitting your car with a dashboard that tells you not just the speed, but also the engine's performance, fuel efficiency, and other diagnostics while you drive.
Spans, on the other hand, are the specific segments of time measured by instrumentation. In our car analogy, a span would be the time taken for a specific part of your journey, like from your home to the highway. In the context of web applications, a span could represent the time taken to execute a database query, process a request, or complete any other discrete operation.
Instrumentation helps us create a series of spans that together form a detailed timeline of how a request is handled. This timeline is invaluable for pinpointing where delays occur and understanding the overall flow of a request through our system.
Implementing Instrumentation in Our Code
With our PurchaseProductView, we're particularly interested in the database interactions that create customer records and process purchases. By adding instrumentation to this view, we'll be able to measure these interactions and get actionable data on their performance.
Here's how we integrate AppSignal's custom instrumentation into our Django view:
# store/views.py
# Import OpenTelemetry's trace module for creating custom spans
from opentelemetry import trace
# Import AppSignal's set_root_name for customizing the trace name
from appsignal import set_root_name

# Inside the PurchaseProductView
def post(self, request, *args, **kwargs):
    # Initialize the tracer for this view
    tracer = trace.get_tracer(__name__)

    # Start a new span for the view using 'with' statement
    with tracer.start_as_current_span("PurchaseProductView"):
        # Customize the name of the trace to be more descriptive
        set_root_name("POST /store/purchase/<slug>")

        # ... existing code to handle the purchase ...

        # Start another span to monitor the database query performance
        with tracer.start_as_current_span("Database Query - Retrieve or Create Customer"):
            # ... code to retrieve or create a customer ...

            # Yet another span to monitor the purchase record creation
            with tracer.start_as_current_span("Database Query - Create Purchase Record"):
                # ... code to create a purchase record ...
See the full code of the view after the modification.
In this updated view, custom instrumentation is added to measure the performance of database queries when retrieving or creating a customer and creating a purchase record.
Now, after purchasing a product in the Slow events section of the Performance dashboard, you should see the purchase event, its performance, and how long it takes to run the query.

purchase is the event we added to our view.
Using AppSignal with an Existing Django App
In this section, we are going to see how we can integrate AppSignal with Open edX, an open-source learning management system based on Python and Django.
Monitoring the performance of learning platforms like Open edX is highly important, since a slow experience directly impacts students' engagement with learning materials and can have a negative impact (for example, a high number of users might decide not to continue with a course).
Integrate AppSignal
Here, we can follow similar steps as the Project Setup section. However, for Open edX, we will follow Production Setup and initiate AppSignal in wsgi.py. Check out this commit to install and integrate AppSignal with Open edX.
Monitor Open edX Performance
Now we'll interact with our platform and see the performance result in the dashboard.
Let's register a user, log in, enroll them in multiple courses, and interact with the course content.
Actions
Going to Actions, let's order the actions based on their mean time and find slow events:
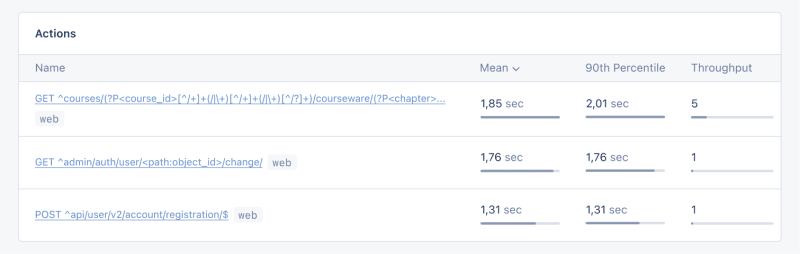
As we can see, for 3 events (out of the 34 events we tested) the response time is higher than 1 second.
Host Metrics
Host Metrics in AppSignal show resource usage:

我们的系统负载并不重 - 负载平均值为 0.03 - 但内存使用率很高。
我们还可以添加一个触发器,以便在资源使用达到特定条件时收到通知。例如,我们可以设置一个触发器,当内存使用率高于 80% 时收到通知并防止中断。

当我们满足条件时,您应该会收到如下所示的通知:

Celery 任务监控
在 Open edX 中,我们使用 Celery 来执行异步和长时间运行的任务,例如证书生成、评分和批量电子邮件功能。
根据任务和用户数量,其中一些任务可能会运行很长时间并导致我们平台出现性能问题。
例如,如果数千名用户注册了一门课程,并且我们需要对他们重新评分,则此任务可能需要一段时间。我们可能会收到用户的抱怨,他们的成绩没有反映在仪表板中,因为任务仍在运行。掌握有关 Celery 任务、运行时间和资源使用情况的信息可以为我们提供重要的见解以及应用程序可能的改进点。
让我们使用 AppSignal 来跟踪 Open edX 中的 Celery 任务并在仪表板中查看结果。首先,确保安装了必要的要求。接下来,让我们设置任务来跟踪 Celery 性能,就像此提交中一样。
现在,让我们在 Open edX 仪表板中运行几个任务来重置尝试并对学习者的提交重新评分:
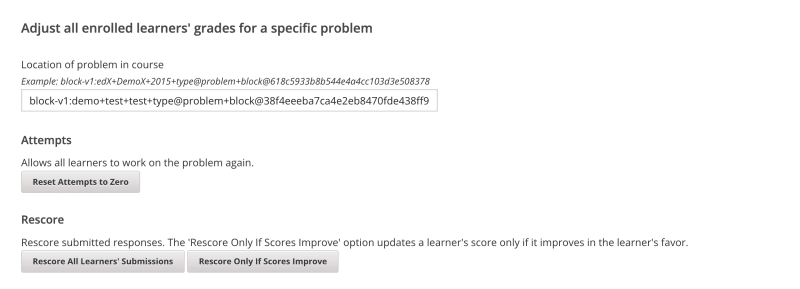
我们将转到 AppSignal 中的 性能 仪表板 -> 缓慢事件,我们会看到类似:
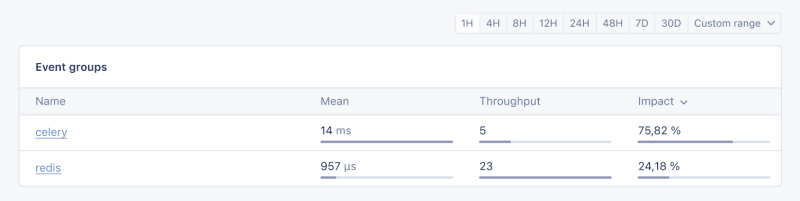
通过单击 Celery,我们将看到在 Open edX 上运行的所有任务:

这是非常有用的信息,可以帮助我们了解任务的运行时间是否比预期长,这样我们就可以解决任何可能的性能瓶颈。
就是这样!
总结
在本文中,我们了解了 AppSignal 如何帮助我们深入了解 Django 应用程序的性能。
我们监控了一个简单的电子商务 Django 应用程序,包括并发用户、数据库查询和响应时间等指标。
作为案例研究,我们将 AppSignal 与 Open edX 集成,揭示了性能监控如何有助于增强用户体验,特别是对于使用该平台的学生而言。
编码愉快!
P.S.如果您想在 Python 文章发布后立即阅读,请订阅我们的 Python Wizardry 时事通讯,不错过任何一篇文章!
以上是使用 AppSignal 监控 Python Django 应用程序的性能的详细内容。更多信息请关注PHP中文网其他相关文章!

热AI工具

Undresser.AI Undress
人工智能驱动的应用程序,用于创建逼真的裸体照片

AI Clothes Remover
用于从照片中去除衣服的在线人工智能工具。

Undress AI Tool
免费脱衣服图片

Clothoff.io
AI脱衣机

Video Face Swap
使用我们完全免费的人工智能换脸工具轻松在任何视频中换脸!

热门文章
热工具

记事本++7.3.1
好用且免费的代码编辑器

SublimeText3汉化版
中文版,非常好用

禅工作室 13.0.1
功能强大的PHP集成开发环境

Dreamweaver CS6
视觉化网页开发工具

SublimeText3 Mac版
神级代码编辑软件(SublimeText3)


 Python:游戏,Guis等
Apr 13, 2025 am 12:14 AM
Python:游戏,Guis等
Apr 13, 2025 am 12:14 AM
Python在游戏和GUI开发中表现出色。1)游戏开发使用Pygame,提供绘图、音频等功能,适合创建2D游戏。2)GUI开发可选择Tkinter或PyQt,Tkinter简单易用,PyQt功能丰富,适合专业开发。
 Python与C:学习曲线和易用性
Apr 19, 2025 am 12:20 AM
Python与C:学习曲线和易用性
Apr 19, 2025 am 12:20 AM
Python更易学且易用,C 则更强大但复杂。1.Python语法简洁,适合初学者,动态类型和自动内存管理使其易用,但可能导致运行时错误。2.C 提供低级控制和高级特性,适合高性能应用,但学习门槛高,需手动管理内存和类型安全。
 Python和时间:充分利用您的学习时间
Apr 14, 2025 am 12:02 AM
Python和时间:充分利用您的学习时间
Apr 14, 2025 am 12:02 AM
要在有限的时间内最大化学习Python的效率,可以使用Python的datetime、time和schedule模块。1.datetime模块用于记录和规划学习时间。2.time模块帮助设置学习和休息时间。3.schedule模块自动化安排每周学习任务。
 Python vs.C:探索性能和效率
Apr 18, 2025 am 12:20 AM
Python vs.C:探索性能和效率
Apr 18, 2025 am 12:20 AM
Python在开发效率上优于C ,但C 在执行性能上更高。1.Python的简洁语法和丰富库提高开发效率。2.C 的编译型特性和硬件控制提升执行性能。选择时需根据项目需求权衡开发速度与执行效率。
 Python标准库的哪一部分是:列表或数组?
Apr 27, 2025 am 12:03 AM
Python标准库的哪一部分是:列表或数组?
Apr 27, 2025 am 12:03 AM
pythonlistsarepartofthestAndArdLibrary,herilearRaysarenot.listsarebuilt-In,多功能,和Rused ForStoringCollections,而EasaraySaraySaraySaraysaraySaraySaraysaraySaraysarrayModuleandleandleandlesscommonlyusedDduetolimitedFunctionalityFunctionalityFunctionality。
 学习Python:2小时的每日学习是否足够?
Apr 18, 2025 am 12:22 AM
学习Python:2小时的每日学习是否足够?
Apr 18, 2025 am 12:22 AM
每天学习Python两个小时是否足够?这取决于你的目标和学习方法。1)制定清晰的学习计划,2)选择合适的学习资源和方法,3)动手实践和复习巩固,可以在这段时间内逐步掌握Python的基本知识和高级功能。
 Python:自动化,脚本和任务管理
Apr 16, 2025 am 12:14 AM
Python:自动化,脚本和任务管理
Apr 16, 2025 am 12:14 AM
Python在自动化、脚本编写和任务管理中表现出色。1)自动化:通过标准库如os、shutil实现文件备份。2)脚本编写:使用psutil库监控系统资源。3)任务管理:利用schedule库调度任务。Python的易用性和丰富库支持使其在这些领域中成为首选工具。
 Python vs. C:了解关键差异
Apr 21, 2025 am 12:18 AM
Python vs. C:了解关键差异
Apr 21, 2025 am 12:18 AM
Python和C 各有优势,选择应基于项目需求。1)Python适合快速开发和数据处理,因其简洁语法和动态类型。2)C 适用于高性能和系统编程,因其静态类型和手动内存管理。
