

使用 Google Apps 脚本和 Leaflet.js 构建交互式 XY 图像图

Google 地图有大量用于在地图上绘制点的功能,但是如果您想在图像上绘制点怎么办?这些 XY 图像绘图通常用于楼层地图、工作现场检查,甚至游戏。
在本指南中,我将向您展示如何使用 Leaflet.js 和 Google Apps 脚本创建带有可拖动点的交互式地图。我们将涵盖从设置地图到集成 Google 表格中的数据以及将其部署为网络应用程序的所有内容。
本指南将涵盖:
在 Google Apps 脚本 HTML 服务中设置 Leaflet.js
使用 Google 表格中的数据显示标记
移动标记时更新表格行
从地图创建新标记并保存到表格
从网络应用程序中删除标记
在 Google Apps 脚本 HTML 服务中设置 Leaflet.js
Leaflet.js 是最流行的开源地图库之一。它重量轻,易于使用,并且有很好的文档。它们支持大量不同的地图类型,包括“CRS.Simple”或坐标参考系统,它允许您提供背景图像。
Google 表格设置
首先创建一个名为map_pin 的工作表,其结构如下:
| id | title | x | y |
|---|---|---|---|
| 1 | test1 | 10 | 30 |
| 2 | test2 | 50 | 80 |
然后从“扩展”菜单中打开 Apps 脚本。
创建 HTML 文件
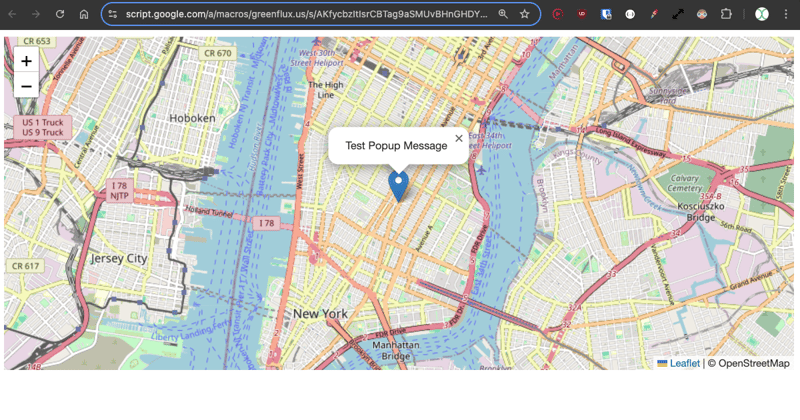
首先,我们将从 Leaflet 文档中的基本示例开始,以使库正常工作。您可以在此处的快速入门指南中查看完整示例。
添加一个新的HTML文件,命名为Index,并将内容设置为:
<!DOCTYPE html>
<html>
<head>
  <title>Quick Start - Leaflet</title>
  <meta charset="utf-8" />
  <meta name="viewport" content="width=device-width, initial-scale=1.0">
  <link rel="stylesheet" href="https://unpkg.com/leaflet@1.9.3/dist/leaflet.css" />
  <style>
    #map {
      height: 400px;
    }
  </style>
</head>
<body>
  <div id="map"></div>

  <script src="https://unpkg.com/leaflet@1.9.3/dist/leaflet.js"></script>
  <script>
    var map = L.map('map').setView([40.73, -73.99], 13);

    L.tileLayer('https://{s}.tile.openstreetmap.org/{z}/{x}/{y}.png', {
      maxZoom: 19,
      attribution: '© OpenStreetMap'
    }).addTo(map);

    var marker = L.marker([40.73, -73.99]).addTo(map)
      .bindPopup('Test Popup Message')
      .openPopup();
  </script>
</body>
</html>
然后使用以下内容更新 Code.gs 文件:
function doGet() {
  const html = HtmlService.createHtmlOutputFromFile('Index')
    .setTitle('Map with Draggable Points')
    .setXFrameOptionsMode(HtmlService.XFrameOptionsMode.ALLOWALL);
  return html;
}
保存,然后单击部署,并发布为 Web 应用程序。然后打开新部署的链接,您应该会看到 Leaflet.js 显示纽约的地图。
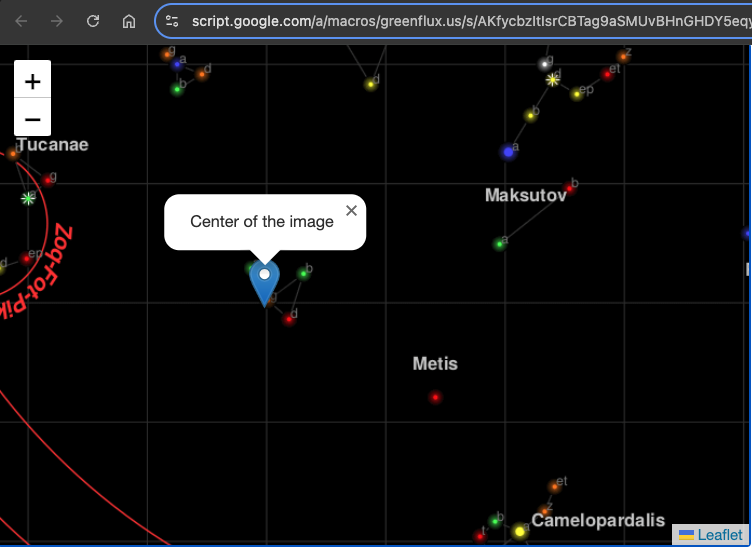
好的,这就是使用 Leaflet 的常规地图示例。现在介绍 CRS.Simple 地图类型,它允许提供背景图像。
使用传单教程中的示例更新 HTML。
<!DOCTYPE html>
<html>
<head>
  <title>CRS Simple Example - Leaflet</title>
  <meta charset="utf-8" />
  <meta name="viewport" content="width=device-width, initial-scale=1.0">
  <link rel="stylesheet" href="https://unpkg.com/leaflet@1.9.3/dist/leaflet.css" />
  <style>
    #map {
      height: 400px;
      width: 600px;
    }
    body {
      margin: 0;
      padding: 0;
    }
  </style>
</head>
<body>
  <div id="map"></div>

  <script src="https://unpkg.com/leaflet@1.9.3/dist/leaflet.js"></script>
  <script>
    // Set up the map with a simple CRS (no geographic projection)
    var map = L.map('map', {
      crs: L.CRS.Simple,
      minZoom: -1,
      maxZoom: 4
    });

    // Define the dimensions of the image
    var bounds = [[0, 0], [1000, 1000]];
    var image = L.imageOverlay('https://leafletjs.com/examples/crs-simple/uqm_map_full.png', bounds).addTo(map);

    // Set the initial view of the map to show the whole image
    map.fitBounds(bounds);

    // Optional: Add a marker or other elements to the map
    var marker = L.marker([500, 500]).addTo(map)
      .bindPopup('Center of the image')
      .openPopup();
  </script>
</body>
</html>
这里我们提供一张 1000 x 1000 像素的图像,然后将中心标记设置为 500、500。
点击保存,然后部署>测试部署,查看新的地图类型。您现在应该拥有一张带有背景图像并在中心绘制了标记的地图。
使用 Google 表格中的数据初始化地图
接下来,我们将使用工作表中的数据来填充地图上的一组标记。
首先,在 Code.gs 文件中添加一个函数来获取标记位置:
function getPinData(){
  const ss = SpreadsheetApp.getActiveSpreadsheet();
  const sh = ss.getSheetByName('map_pin');
  const data = sh.getDataRange().getValues();
  const json = arrayToJSON(data);
  //Logger.log(json);
  return json
}

function arrayToJSON(data=getPinData()){
  const headers = data[0];
  const rows = data.slice(1);
  let jsonData = [];
  for(row of rows){
    const obj = {};
    headers.forEach((h,i)=>obj[h] = row[i]);
    jsonData.push(obj)
  }
  //Logger.log(jsonData)
  return jsonData
}
在这里,我以 JSON 形式返回引脚,以便在下一节中更容易在 HTML 中使用它们。
现在向 HTML 添加一个函数以循环此 JSON 并在地图加载后创建地图图钉。
// Add map pins from sheet data
    google.script.run.withSuccessHandler(addMarkers).getPinData();

    function addMarkers(mapPinData) {
      mapPinData.forEach(pin => {
        const marker = L.marker([pin.x, pin.y], {
          draggable: true
        }).addTo(map);

        marker.bindPopup(`<b>${pin.title}`).openPopup();

        marker.on('dragend', function(e) {
          const latLng = e.target.getLatLng();
          console.log(`Marker ${pin.title} moved to: ${latLng.lat}, ${latLng.lng}`);
        });
      });
    }
保存,然后打开测试部署。您现在应该已经从工作表数据生成了标记!
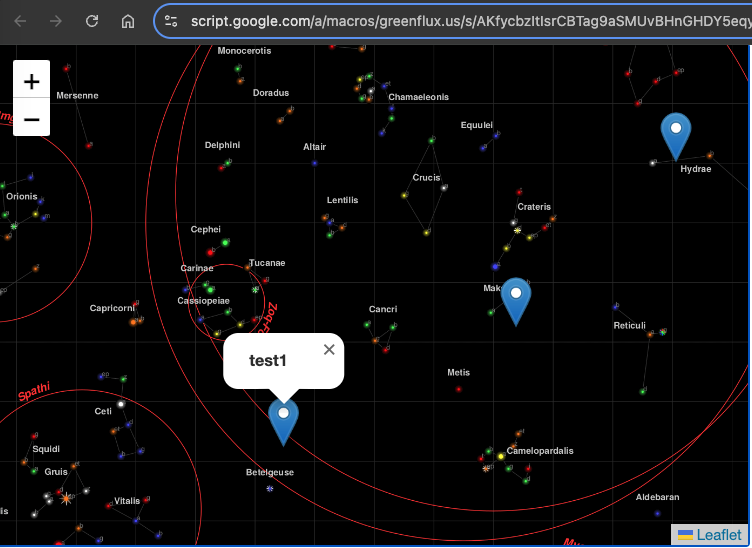
每个图钉都有一个弹出窗口,其中包含该行的标题。此时图钉可以拖动,但我们仍然需要一个函数来保存新位置。
拖动时保存标记位置
为了保存新位置,我们需要两个函数:一个在 HTML 中用于捕获客户端的事件,另一个用于在服务器端的 Code.gs 文件中保存新位置。
使用以下内容更新 HTML:
    function addMarkers(mapPinData) {
      mapPinData.forEach(pin => {
        const { id, title, x, y } = pin;
        const marker = L.marker([x, y], {
          draggable: true
        }).addTo(map);

        marker.bindPopup(`<b>${title}</b>`).openPopup();

        marker.on('dragend', function(e) {
          const latLng = e.target.getLatLng();
          console.log(`Marker ${title} moved to: ${latLng.lat}, ${latLng.lng}`);
          saveMarkerPosition({ id, title, lat: latLng.lat, lng: latLng.lng });
        });
      });
    }

    function saveMarkerPosition({ id, title, lat, lng }) {
      google.script.run.saveMarkerPosition({ id, title, lat, lng });
    }
然后在Code.gs文件中添加一个函数来保存位置:
function saveMarkerPosition({ id, lat, lng }) {
  const ss = SpreadsheetApp.getActiveSpreadsheet();
  const sh = ss.getSheetByName('map_pin');
  const data = sh.getDataRange().getValues();

  for (let i = 1; i < data.length; i++) {
    if (data[i][0] === id) {  // ID column (index 0)
      sh.getRange(i + 1, 3).setValue(lat);  // latitude column
      sh.getRange(i + 1, 4).setValue(lng);  // longitude column
      break;
    }
  }
}
保存并刷新测试部署。现在,当拖动标记时,您应该会看到工作表更新!
添加新点
我们现在可以移动现有的点,但是添加新的点怎么样?同样,我们需要两个函数,一个在 HTML 中,一个在 Code.gs 文件中。
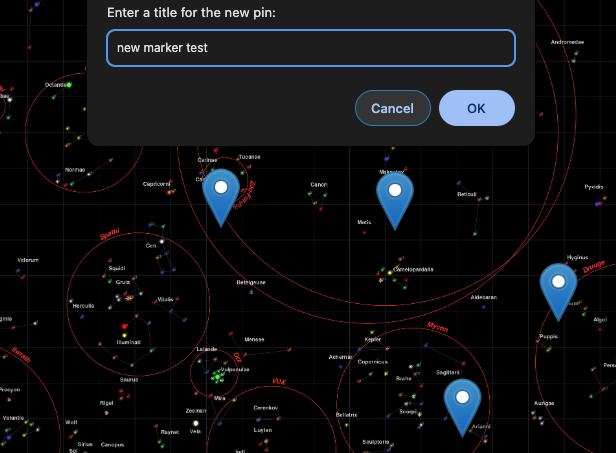
首先,在 HTML 中添加一个函数,以便在用户单击地图上的空白点时打开提示,并将值传递给服务器函数。
    // Function to add a new pin
    map.on('click', function(e) {
      const latLng = e.latlng;
      const title = prompt('Enter a title for the new pin:');
      if (title) {
        google.script.run.withSuccessHandler(function(id) {
          addNewMarker({ id, title, lat: latLng.lat, lng: latLng.lng });
        }).addNewPin({ title, lat: latLng.lat, lng: latLng.lng });
      }
    });

    function addNewMarker({ id, title, lat, lng }) {
      const marker = L.marker([lat, lng], {
        draggable: true
      }).addTo(map);

      marker.bindPopup(`<b>${title}</b>`).openPopup();

      marker.on('dragend', function(e) {
        const latLng = e.target.getLatLng();
        saveMarkerPosition({ id, title, lat: latLng.lat, lng: latLng.lng });
      });
    }
然后将函数添加到 Code.gs 以保存新行。
function addNewPin({ title, lat, lng }) {
  const ss = SpreadsheetApp.getActiveSpreadsheet();
  const sh = ss.getSheetByName('map_pin');

  // Check if there are any rows present, if not initialize ID
  const lastRow = sh.getLastRow();
  let newId = 1;

  if (lastRow > 0) {
    const lastId = sh.getRange(lastRow, 1).getValue();
    newId = lastId + 1;
  }

  sh.appendRow([newId, title, lat, lng]);

  return newId;
}
再次保存并刷新测试部署。现在,当您单击空白处时,您可以输入标题并保存新标记!
删除标记
最后,我们应该添加一种删除标记的方法,从而在地图视图中为我们提供完整的 CRUD 应用程序。
更新添加标记功能,为弹出窗口提供删除按钮:
      const popupContent = `<b>${title}</b><br><button onclick="deleteMarker(${id})">Delete Marker</button>`;
      marker.bindPopup(popupContent).openPopup();
然后添加客户端删除的功能:
// Function to delete a marker
  function deleteMarker(id) {
    const confirmed = confirm('Are you sure you want to delete this marker?');
    if (confirmed) {
      google.script.run.withSuccessHandler(() => {
        // Refresh the markers after deletion
        google.script.run.withSuccessHandler(addMarkers).getPinData();
      }).deleteMarker(id);
    }
  }
然后将匹配的函数添加到Code.gs文件中:
function deleteMarker(id) {
  const ss = SpreadsheetApp.getActiveSpreadsheet();
  const sh = ss.getSheetByName('map_pin');
  const data = sh.getDataRange().getValues();

  for (let i = 1; i < data.length; i++) {
    if (data[i][0] === id) {  // ID column (index 0)
      sh.deleteRow(i + 1);  // Delete the row
      break;
    }
  }
}
接下来是什么?
您还可以从这里做很多事情,例如向每个标记添加其他数据点、动态背景图像或其他单击和拖动交互。你甚至可以制作游戏!有用例的想法吗?在下面发表评论!
以上是使用 Google Apps 脚本和 Leaflet.js 构建交互式 XY 图像图的详细内容。更多信息请关注PHP中文网其他相关文章!

热AI工具

Undresser.AI Undress
人工智能驱动的应用程序,用于创建逼真的裸体照片

AI Clothes Remover
用于从照片中去除衣服的在线人工智能工具。

Undress AI Tool
免费脱衣服图片

Clothoff.io
AI脱衣机

AI Hentai Generator
免费生成ai无尽的。

热门文章
热工具

记事本++7.3.1
好用且免费的代码编辑器

SublimeText3汉化版
中文版,非常好用

禅工作室 13.0.1
功能强大的PHP集成开发环境

Dreamweaver CS6
视觉化网页开发工具

SublimeText3 Mac版
神级代码编辑软件(SublimeText3)
热门话题


 如何在浏览器中优化JavaScript代码以进行性能?
Mar 18, 2025 pm 03:14 PM
如何在浏览器中优化JavaScript代码以进行性能?
Mar 18, 2025 pm 03:14 PM
本文讨论了在浏览器中优化JavaScript性能的策略,重点是减少执行时间并最大程度地减少对页面负载速度的影响。

 如何使用浏览器开发人员工具有效调试JavaScript代码?
Mar 18, 2025 pm 03:16 PM
如何使用浏览器开发人员工具有效调试JavaScript代码?
Mar 18, 2025 pm 03:16 PM
本文讨论了使用浏览器开发人员工具的有效JavaScript调试,专注于设置断点,使用控制台和分析性能。
 谁得到更多的Python或JavaScript?
Apr 04, 2025 am 12:09 AM
谁得到更多的Python或JavaScript?
Apr 04, 2025 am 12:09 AM
Python和JavaScript开发者的薪资没有绝对的高低,具体取决于技能和行业需求。1.Python在数据科学和机器学习领域可能薪资更高。2.JavaScript在前端和全栈开发中需求大,薪资也可观。3.影响因素包括经验、地理位置、公司规模和特定技能。
 如何使用源地图调试缩小JavaScript代码?
Mar 18, 2025 pm 03:17 PM
如何使用源地图调试缩小JavaScript代码?
Mar 18, 2025 pm 03:17 PM
本文说明了如何使用源地图通过将其映射回原始代码来调试JAVASCRIPT。它讨论了启用源地图,设置断点以及使用Chrome DevTools和WebPack之类的工具。
 如何使用JavaScript将具有相同ID的数组元素合并到一个对象中?
Apr 04, 2025 pm 05:09 PM
如何使用JavaScript将具有相同ID的数组元素合并到一个对象中?
Apr 04, 2025 pm 05:09 PM
如何在JavaScript中将具有相同ID的数组元素合并到一个对象中?在处理数据时,我们常常会遇到需要将具有相同ID�...
 console.log输出结果差异:两次调用为何不同?
Apr 04, 2025 pm 05:12 PM
console.log输出结果差异:两次调用为何不同?
Apr 04, 2025 pm 05:12 PM
深入探讨console.log输出差异的根源本文将分析一段代码中console.log函数输出结果的差异,并解释其背后的原因。�...
