

Python 计算机视觉简介(第 1 部分)

注意:在这篇文章中,我们将仅使用灰度图像以使其易于理解。
什么是图像?
图像可以被认为是值的矩阵,其中每个值代表像素的强度。图像格式主要分为三种类型:
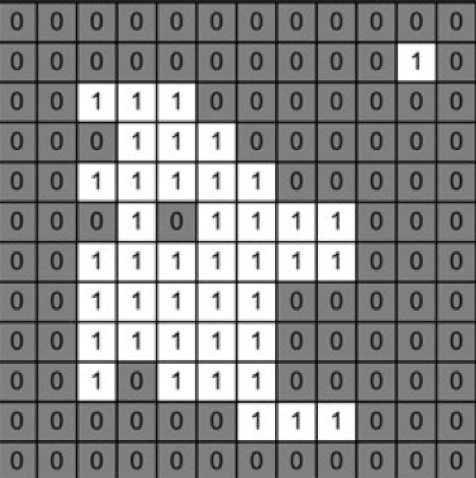
- 二进制:此格式的图像由值为 0(黑色)和 1(白色)的单个二维矩阵表示。这是最简单的图像表示形式。
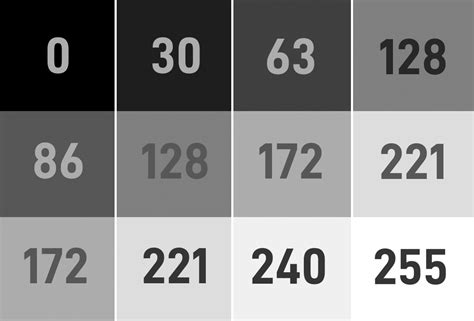
- Grey-Scale:在此格式中,图像由值范围为 0 到 255 的单个二维矩阵表示;其中 0 代表黑色,255 代表白色。中间值代表不同的灰色深浅。
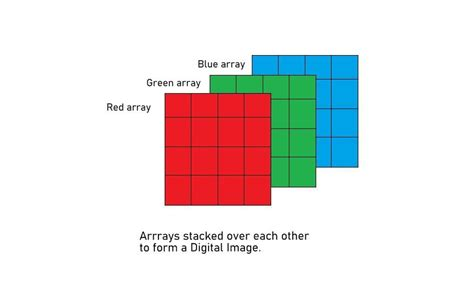
- RGB Scale:这里,图像由三个二维矩阵表示(每个颜色通道一个:红色、绿色和蓝色),值范围从 0 到 255。每个矩阵包含以下像素值:一个颜色分量,结合这三个通道就可以得到全彩色图像。
过滤器
滤镜是用于通过应用某些操作来修改图像的工具。滤波器是一个在图像上移动的矩阵(也称为内核),对其窗口内的像素值执行计算。我们将介绍两种常见类型的滤波器:均值滤波器和中值滤波器。
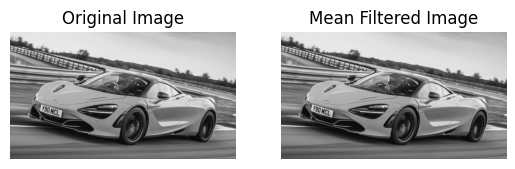
均值滤波器
均值滤波器用于通过对窗口内的像素值进行平均来减少噪声。它将窗口中的中心像素替换为该窗口内所有像素值的平均值。 cv2.blur() 函数应用内核大小为 3x3 的均值滤波器,这意味着它会考虑每个像素周围的 3x3 像素窗口来计算平均值。这有助于平滑图像。
import cv2
import matplotlib.pyplot as plt

image = cv2.imread('McLaren-720S-Price-1200x675.jpg', cv2.IMREAD_GRAYSCALE)

# Applies a Mean Filter of size 3 x 3
blurred_image = cv2.blur(image, (3, 3))

plt.subplot(1, 2, 1)
plt.imshow(image, cmap='gray')
plt.title('Original Image')
plt.axis("off")

plt.subplot(1, 2, 2)
plt.imshow(blurred_image, cmap='gray')
plt.title('Mean Filtered Image')
plt.axis("off")
plt.show()
中值滤波器
中值滤波器用于通过将每个像素的值替换为窗口中所有像素的中值来减少噪声。它对于消除椒盐噪声特别有效。 cv2.medianBlur() 函数应用内核大小为 3 的中值滤波器。此方法将每个像素替换为其邻域像素值的中值,这有助于在去除噪声的同时保留边缘。这里,内核尺寸越大,图像越模糊。
import cv2
import matplotlib.pyplot as plt

image = cv2.imread('McLaren-720S-Price-1200x675.jpg', cv2.IMREAD_GRAYSCALE)

# Applies a Median Filter with a kernel size of 3
blurred_image = cv2.medianBlur(image, 3)

plt.subplot(1, 2, 1)
plt.imshow(image, cmap='gray')
plt.title('Original Image')
plt.axis("off")

plt.subplot(1, 2, 2)
plt.imshow(blurred_image, cmap='gray')
plt.title('Median Filtered Image')
plt.axis("off")
plt.show()

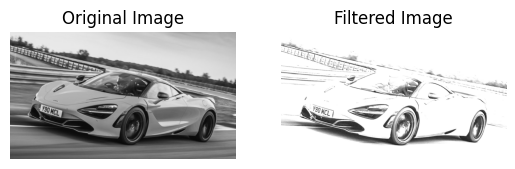
自定义过滤器
您可以创建自定义过滤器以对图像应用特定操作。 cv2.filter2D() 函数允许您将任何自定义内核应用于图像。 cv2.filter2D() 函数将自定义内核(过滤器)应用于图像。内核是一个矩阵,定义对像素值执行的操作。在此示例中,内核根据指定的值增强图像的某些特征。
import cv2
import numpy as np
import matplotlib.pyplot as plt

image = cv2.imread('McLaren-720S-Price-1200x675.jpg', cv2.IMREAD_GRAYSCALE)

# Define a custom filter kernel
kernel = np.array([[2, -1, 5],
                   [-5, 5, -1],
                   [0, -1, 0]])

filtered_image = cv2.filter2D(image, -1, kernel)

plt.subplot(1, 2, 1)
plt.imshow(image, cmap='gray')
plt.title('Original Image')
plt.axis('off')

plt.subplot(1, 2, 2)
plt.imshow(filtered_image, cmap='gray')
plt.title('Filtered Image')
plt.axis('off')

plt.show()
阈值化
注意:在代码片段中,在分配阈值图像时,您将看到 _ ,图像。这是因为 cv2.threshold 函数返回两个值:使用的阈值和阈值化图像。由于我们只需要阈值图像,因此我们使用 _ 来忽略阈值。
阈值处理通过根据条件设置像素值将图像转换为二值图像。阈值技术有多种类型:
全局阈值
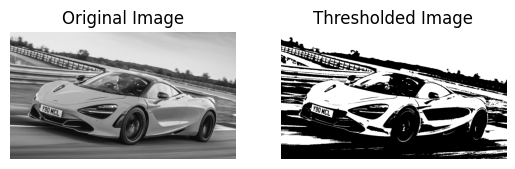
简单阈值处理
该方法为整个图像设置一个固定的阈值。值高于阈值的像素设置为最大值 (255),低于阈值的像素设置为 0。 cv2.threshold() 函数用于简单阈值处理。强度大于 127 的像素设置为白色 (255),强度小于或等于 127 的像素设置为黑色 (0),生成二值图像。
import cv2
import matplotlib.pyplot as plt

image = cv2.imread('McLaren-720S-Price-1200x675.jpg', cv2.IMREAD_GRAYSCALE)

_, thresholded_image = cv2.threshold(image, 127, 255, cv2.THRESH_BINARY)

plt.subplot(1, 2, 1)
plt.imshow(image, cmap='gray')
plt.title('Original Image')
plt.axis("off")

plt.subplot(1, 2, 2)
plt.imshow(thresholded_image, cmap='gray')
plt.title('Thresholded Image')
plt.axis("off")
plt.show()
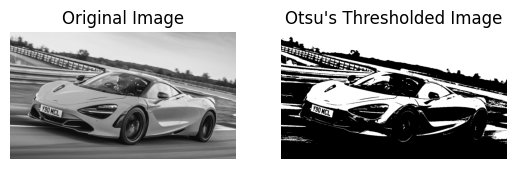
Otsu Thresholding
Otsu's method determines the optimal threshold value automatically based on the histogram of the image. This method minimizes intra-class variance and maximizes inter-class variance. By setting the threshold value to 0 and using cv2.THRESH_OTSU, the function automatically calculates the best threshold value to separate the foreground from the background.
import cv2
import matplotlib.pyplot as plt

image = cv2.imread('McLaren-720S-Price-1200x675.jpg', cv2.IMREAD_GRAYSCALE)

_, otsu_thresholded_image = cv2.threshold(image, 0, 255, cv2.THRESH_BINARY + cv2.THRESH_OTSU)

plt.subplot(1, 2, 1)
plt.imshow(image, cmap='gray')
plt.title('Original Image')
plt.axis("off")

plt.subplot(1, 2, 2)
plt.imshow(otsu_thresholded_image, cmap='gray')
plt.title("Otsu's Thresholded Image")
plt.axis("off")
plt.show()
Adaptive Thresholding
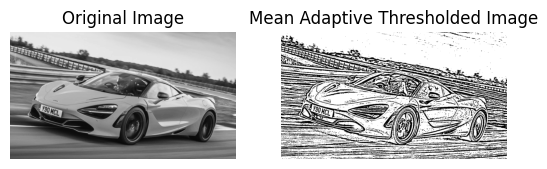
Mean Adaptive Thresholding
In Mean Adaptive Thresholding, the threshold value for each pixel is calculated based on the average of pixel values in a local neighborhood around that pixel. This method adjusts the threshold dynamically across different regions of the image. The cv2.adaptiveThreshold() function calculates the threshold for each pixel based on the mean value of the pixel values in a local 11x11 neighborhood. A constant value of 2 is subtracted from this mean to fine-tune the threshold. This method is effective for images with varying lighting conditions.
import cv2
import matplotlib.pyplot as plt

image = cv2.imread('McLaren-720S-Price-1200x675.jpg', cv2.IMREAD_GRAYSCALE)

mean_adaptive_thresholded_image = cv2.adaptiveThreshold(image, 255, cv2.ADAPTIVE_THRESH_MEAN_C, cv2.THRESH_BINARY, 11, 2)

plt.subplot(1, 2, 1)
plt.imshow(image, cmap='gray')
plt.title('Original Image')
plt.axis("off")

plt.subplot(1, 2, 2)
plt.imshow(mean_adaptive_thresholded_image, cmap='gray')
plt.title('Mean Adaptive Thresholded Image')
plt.axis("off")
plt.show()
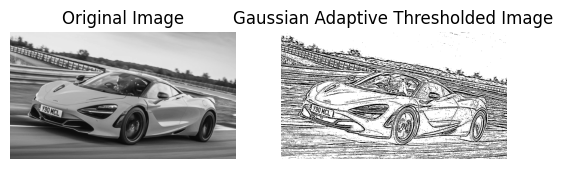
Gaussian Adaptive Thresholding
Gaussian Adaptive Thresholding computes the threshold value for each pixel based on a Gaussian-weighted sum of the pixel values in a local neighborhood. This method often provides better results in cases with non-uniform illumination. In Gaussian Adaptive Thresholding, the threshold is determined by a Gaussian-weighted sum of pixel values in an 11x11 neighborhood. The constant value 2 is subtracted from this weighted mean to adjust the threshold. This method is useful for handling images with varying lighting and shadows.
import cv2
import matplotlib.pyplot as plt

image = cv2.imread('McLaren-720S-Price-1200x675.jpg', cv2.IMREAD_GRAYSCALE)

gaussian_adaptive_thresholded_image = cv2.adaptiveThreshold(image, 255, cv2.ADAPTIVE_THRESH_GAUSSIAN_C, cv2.THRESH_BINARY, 11, 2)

plt.subplot(1, 2, 1)
plt.imshow(image, cmap='gray')
plt.title('Original Image')
plt.axis("off")

plt.subplot(1, 2, 2)
plt.imshow(gaussian_adaptive_thresholded_image, cmap='gray')
plt.title('Gaussian Adaptive Thresholded Image')
plt.axis("off")
plt.show()
References
- Encord.com
- Pyimagesearch.com
- OpenCV Thresholding
- OpenCV Filtering
以上是Python 计算机视觉简介(第 1 部分)的详细内容。更多信息请关注PHP中文网其他相关文章!

热AI工具

Undresser.AI Undress
人工智能驱动的应用程序,用于创建逼真的裸体照片

AI Clothes Remover
用于从照片中去除衣服的在线人工智能工具。

Undress AI Tool
免费脱衣服图片

Clothoff.io
AI脱衣机

Video Face Swap
使用我们完全免费的人工智能换脸工具轻松在任何视频中换脸!

热门文章
热工具

记事本++7.3.1
好用且免费的代码编辑器

SublimeText3汉化版
中文版,非常好用

禅工作室 13.0.1
功能强大的PHP集成开发环境

Dreamweaver CS6
视觉化网页开发工具

SublimeText3 Mac版
神级代码编辑软件(SublimeText3)


 Python与C:学习曲线和易用性
Apr 19, 2025 am 12:20 AM
Python与C:学习曲线和易用性
Apr 19, 2025 am 12:20 AM
Python更易学且易用,C 则更强大但复杂。1.Python语法简洁,适合初学者,动态类型和自动内存管理使其易用,但可能导致运行时错误。2.C 提供低级控制和高级特性,适合高性能应用,但学习门槛高,需手动管理内存和类型安全。
 学习Python:2小时的每日学习是否足够?
Apr 18, 2025 am 12:22 AM
学习Python:2小时的每日学习是否足够?
Apr 18, 2025 am 12:22 AM
每天学习Python两个小时是否足够?这取决于你的目标和学习方法。1)制定清晰的学习计划,2)选择合适的学习资源和方法,3)动手实践和复习巩固,可以在这段时间内逐步掌握Python的基本知识和高级功能。
 Python vs.C:探索性能和效率
Apr 18, 2025 am 12:20 AM
Python vs.C:探索性能和效率
Apr 18, 2025 am 12:20 AM
Python在开发效率上优于C ,但C 在执行性能上更高。1.Python的简洁语法和丰富库提高开发效率。2.C 的编译型特性和硬件控制提升执行性能。选择时需根据项目需求权衡开发速度与执行效率。
 Python vs. C:了解关键差异
Apr 21, 2025 am 12:18 AM
Python vs. C:了解关键差异
Apr 21, 2025 am 12:18 AM
Python和C 各有优势,选择应基于项目需求。1)Python适合快速开发和数据处理,因其简洁语法和动态类型。2)C 适用于高性能和系统编程,因其静态类型和手动内存管理。
 Python标准库的哪一部分是:列表或数组?
Apr 27, 2025 am 12:03 AM
Python标准库的哪一部分是:列表或数组?
Apr 27, 2025 am 12:03 AM
pythonlistsarepartofthestAndArdLibrary,herilearRaysarenot.listsarebuilt-In,多功能,和Rused ForStoringCollections,而EasaraySaraySaraySaraysaraySaraySaraysaraySaraysarrayModuleandleandleandlesscommonlyusedDduetolimitedFunctionalityFunctionalityFunctionality。
 Python:自动化,脚本和任务管理
Apr 16, 2025 am 12:14 AM
Python:自动化,脚本和任务管理
Apr 16, 2025 am 12:14 AM
Python在自动化、脚本编写和任务管理中表现出色。1)自动化:通过标准库如os、shutil实现文件备份。2)脚本编写:使用psutil库监控系统资源。3)任务管理:利用schedule库调度任务。Python的易用性和丰富库支持使其在这些领域中成为首选工具。
 科学计算的Python:详细的外观
Apr 19, 2025 am 12:15 AM
科学计算的Python:详细的外观
Apr 19, 2025 am 12:15 AM
Python在科学计算中的应用包括数据分析、机器学习、数值模拟和可视化。1.Numpy提供高效的多维数组和数学函数。2.SciPy扩展Numpy功能,提供优化和线性代数工具。3.Pandas用于数据处理和分析。4.Matplotlib用于生成各种图表和可视化结果。
 Web开发的Python:关键应用程序
Apr 18, 2025 am 12:20 AM
Web开发的Python:关键应用程序
Apr 18, 2025 am 12:20 AM
Python在Web开发中的关键应用包括使用Django和Flask框架、API开发、数据分析与可视化、机器学习与AI、以及性能优化。1.Django和Flask框架:Django适合快速开发复杂应用,Flask适用于小型或高度自定义项目。2.API开发:使用Flask或DjangoRESTFramework构建RESTfulAPI。3.数据分析与可视化:利用Python处理数据并通过Web界面展示。4.机器学习与AI:Python用于构建智能Web应用。5.性能优化:通过异步编程、缓存和代码优
