
作为一名在汽车行业工作的软件工程师,我对自动驾驶汽车、数据测量技术和分析方法有着浓厚的兴趣。在这篇文章中,我将描述一个定制的测量系统,从头开始详细说明该过程,并展示一些实验结果。我的数据记录器由Raspberry Pi 3、BNO055传感器和ELM327 OBD-II适配器组成,分别负责计算、收集加速度和转速数据以及从实车中检索发动机信息。
1.背景
2.建筑
3.传感器信息
4.坐标系信息
5.数据对比
6.核心逻辑
7.结论
8.参考
近年来,物联网、人工智能和边缘计算的兴起为包括汽车行业在内的各个行业带来了显着进步。现代车辆配备了多种传感器,这些传感器协同工作以创建复杂的系统,从而实现从增强的安全功能到自动驾驶功能的一切。
通常,监控车辆状态需要使用先进且昂贵的传感器来实现精确可靠的测量。然而,对于某些情况,例如获取电路数据以总体了解车辆动力学,这些高端传感器可能并不是绝对必要的。认识到这一点,我决定创建一个经济高效的系统,能够使用更实惠的组件测量车辆的物理状态。
我决定专注于测量与车辆动力学相关的数据,而不是乘坐舒适性。这是因为分析乘坐舒适度需要捕获更多具有合适精度的高频信号,这就需要在测量时设置较高的采样频率。
具体来说,在侧向加速度相对于转向角的频率响应特性中,尽管共振频率取决于车速,但通常出现在 5 Hz 以下。另一方面,在乘坐舒适性分析中,讨论常常延伸到几十Hz的范围。
因此,开发测量系统的首要目标是创建一个低成本的数据记录系统,以促进车辆动力学领域的数据分析。
测量系统由以下硬件组成:
Raspberry Pi 作为主计算机,收集 BNO055 和 ELM327 的数据。 Raspberry Pi 通过 I2C 与 BNO055 通信,并通过蓝牙与 ELM327 通信(见图 1)。

BNO055 传感器能够测量各种类型的运动和数据:★Adafruit BNO055 概述[1]
绝对方向(欧拉向量,100Hz):提供基于 360° 球体的三轴方向数据。
绝对方向(四元数,100Hz):提供四点四元数输出,以实现更准确的数据操作。
角速度矢量 (100Hz):测量三个轴上的旋转速度,以每秒弧度 (rad/s) 为单位。
加速度矢量 (100Hz):捕获三个轴上的加速度,包括重力和线性运动,以米每秒平方 (m/s²) 为单位。
磁场强度矢量 (20Hz):感测三个轴上的磁场强度(以微特斯拉 (μT) 为单位)。
线性加速度矢量 (100Hz):记录三个轴上的线性加速度数据(不包括重力),以米每秒平方 (m/s²) 为单位。
重力矢量 (100Hz):测量三个轴上的重力加速度(不包括任何运动),以米每秒平方 (m/s²) 为单位。
温度 (1Hz):提供环境温度(以摄氏度为单位)。
BNO055 结构紧凑,并受 Adafruit 的 Python 库 Adafruit_CircuitPython 支持。此外,Adafruit 还提供了 C 语言库。
★Adafruit_CircuitPython_BNO055[2]
★Adafruit_BNO055[3]
有关演示,您可以在此处观看视频:
Adafruit BNO055 演示
★Adafruit BNO055 演示[4]
L'ELM327 est un adaptateur OBD-II (On-Board Diagnostics) largement utilisé qui permet d'accéder aux données du moteur du véhicule via une interface standard. Il agit comme un pont entre l'ECU (Electronic Control Unit) du véhicule et les appareils externes tels que les ordinateurs ou les smartphones, permettant la récupération des données de diagnostic et de performances. Les principales caractéristiques et capacités de l'ELM327 incluent :★Informations ELM327[5]
Prise en charge du protocole OBD-II : l'ELM327 prend en charge divers protocoles OBD-II, notamment ISO 9141, ISO 14230 (KWP2000), ISO 15765 (CAN), et plus encore, ce qui le rend compatible avec une large gamme de véhicules.
Codes de diagnostic (DTC) : il peut lire et effacer les codes de diagnostic de l'ECU du véhicule, aidant ainsi à identifier et à résoudre les problèmes.
Diffusion de données en direct : fournit des données en temps réel provenant des capteurs du véhicule, telles que le régime moteur, la vitesse du véhicule, la température du liquide de refroidissement et le niveau de carburant.
Données figées : capture et stocke les données au moment où un défaut est détecté, ce qui aide à diagnostiquer les problèmes intermittents.
Informations sur le véhicule : récupère des détails sur le véhicule, y compris le VIN (numéro d'identification du véhicule), les identifiants d'étalonnage, etc.
Compatibilité : disponible sous diverses formes, notamment les versions Bluetooth, USB et Wi-Fi, permettant la compatibilité avec différents appareils et plates-formes.
En général, l'ELM327 est utilisé pour diagnostiquer l'état du véhicule, en particulier l'état du moteur. Cependant, il peut également être utilisé pour collecter un large éventail de données sur le véhicule. L'ELM327 est disponible à l'achat sur des plateformes comme Amazon, avec des prix allant d'environ 20 $ à 80 $.
À l'aide de la bibliothèque python-OBD, vous pouvez créer des requêtes pour collecter des données via l'adaptateur ELM327, permettant une collecte de données personnalisable et détaillée
Étant donné que ce système interagit avec plusieurs capteurs et un véhicule réel, il doit comprendre chaque système de coordonnées.
L'image ci-dessous montre le système de coordonnées BNO055 pour mon système de mesure de données. Mon système calcule en outre les angles de rotation à l'aide de quaternions. Le système de coordonnées du capteur doit correspondre au système de coordonnées du véhicule.

Le système de mesure fonctionne sur la base du système de coordonnées du véhicule.

J'ai utilisé une application iPhone capable de mesurer plusieurs points de données physiques, notamment l'accélération, le gyroscope, etc., pour les tâches de validation. Le but de l'utilisation de l'application iPhone est de confirmer la validité de mon système de mesure de données avec les données de cette application. La figure 4 est citée sur le site des développeurs d'Apple.

Dans cette section, je présente quelques résultats expérimentaux. Dans un premier temps, j'ai effectué des tâches d'onde sinusoïdale pour confirmer si mon système de mesure produit des lectures sans erreurs, telles que des erreurs d'unité. Cette partie est basique mais cruciale pour garantir la bonne manière de collecter des données.
Ensuite, j'ai mesuré quelques valeurs physiques sur un véhicule réel en conduisant.
Ensuite, j'ai vérifié les performances de l'ELM327 et la précision d'échantillonnage de chaque capteur.
J'ai effectué des tests d'onde sinusoïdale et dans cette section, je présente les résultats. L'objectif de ces tests est de confirmer ce qui suit :
Pour y parvenir, j'ai utilisé « phyphox » ★phyphox[8], une application pour smartphone qui permet de mesurer diverses valeurs physiques. J'ai monté mon capteur BNO055 sur l'iPhone comme indiqué ci-dessous [Figure 5].

La figure 6 montre les résultats du test d'onde sinusoïdale avec une fréquence d'échantillonnage de 10 Hz. La légende « VDDM » représente les données collectées par un système de mesure que j'ai développé, tandis que « iPhone » indique les données collectées à l'aide de « phyphox ».

Les données du VDDM et de l'iPhone montrent des tendances similaires sur tous les axes, indiquant que les deux applications capturent des modèles de mouvement similaires.
Les données VDDM semblent être légèrement plus variables, en particulier dans les graphiques d'accélération, ce qui pourrait suggérer une sensibilité plus élevée ou une approche de filtrage différente par rapport à l'iPhone.
Les deux données concordent généralement bien, mais les différences d'amplitude suggèrent qu'un étalonnage ou un ajustement supplémentaire peut être nécessaire en fonction des exigences de précision.
Le VDDM peut capturer du bruit supplémentaire ou des composants de fréquence plus élevée, en particulier dans les graphiques d'accélération, qui ne sont pas présents dans les données de l'iPhone. Cela pourrait soit être bénéfique pour une analyse détaillée, soit nécessiter un filtrage plus approfondi.
La figure 7 montre les résultats d'une expérience axée sur les données du BNO055 dans un véhicule réel. Une application iPhone appelée « phyphox » a été utilisée comme référence. La fréquence d'échantillonnage était de 50 Hz. J'ai observé que les signaux d'accélération et de rotation mesurés par le système d'enregistrement de données que j'ai développé sur le véhicule contenaient du bruit, des valeurs aberrantes et des valeurs NaN. Par conséquent, j'ai appliqué des fonctions de post-traitement, notamment une méthode IQR et un filtre passe-bas Butterworth. Le terme « fc » dans la légende de chaque graphique représente la fréquence de coupure. Par exemple, fc_19.5 indique une fréquence de coupure de 19,5 Hz. A noter que cette expérience a été réalisée en utilisant uniquement le capteur BNO055, et la fonction ELM327 a été désactivée.

Les données du VDDM (données brutes) et de l'iPhone montrent des tendances similaires sur tous les axes. Cela suggère que les deux systèmes capturent les mêmes modèles de mouvement.
Les données de VDDM semblent présenter une plus grande variation par rapport aux données de l'iPhone. Ceci est particulièrement visible dans les graphiques d'accélération et peut indiquer que VDDM capture des données avec une sensibilité plus élevée ou utilise une approche de filtrage différente.
Les données filtrées de VDDM (avec fc 19,5 Hz et 10 Hz) montrent une variation réduite par rapport aux données brutes et sont plus proches des données de l'iPhone. Cela suggère que le VDDM (données brutes) pourrait inclure davantage de bruit ou de composants haute fréquence.
Les données brutes de VDDM contenaient des valeurs aberrantes et manquantes, qui ont été atténuées par l'application de filtres. Cela est particulièrement évident dans les graphiques du taux de roulis et du taux de tangage.
VDDM semble inclure plus de composants haute fréquence et de bruit que l'iPhone. Bien que cela puisse être avantageux pour une analyse détaillée, un filtrage supplémentaire ou des ajustements au niveau matériel peuvent être nécessaires si la réduction du bruit est critique.
La figure 8 montre les données concernant les performances du moteur. Ces données ont été collectées à l'aide du scanner ELM327 avec une fréquence d'échantillonnage de 4 Hz. La fonction BNO055 a été désactivée lors de la collecte des données.

Semasa eksperimen saya dengan BNO055 dan ELM327, saya memerhatikan kelewatan dalam pensampelan. Untuk mengenal pasti isu, saya melaksanakan pengukuran dengan melaraskan kekerapan pensampelan dan dengan mengaktifkan dan menyahaktifkan ELM327 dan BNO055.
Pada mulanya, saya membentangkan perbezaan masa yang sepadan dengan kekerapan pensampelan. Ujian ini melibatkan penggunaan kedua-dua penderia BNO055 dan ELM327

Rajah 9 menunjukkan bahawa apabila kekerapan pensampelan ditetapkan kepada 10Hz, ketepatan masa pensampelan berkurangan dengan ketara.
ELM327 tidak boleh mencapai frekuensi pensampelan setinggi BNO055, yang mungkin memberi kesan negatif kepada prestasi sistem keseluruhan. Namun begitu, untuk lebih memahami prestasi setiap penderia, saya menjalankan pengukuran individu.
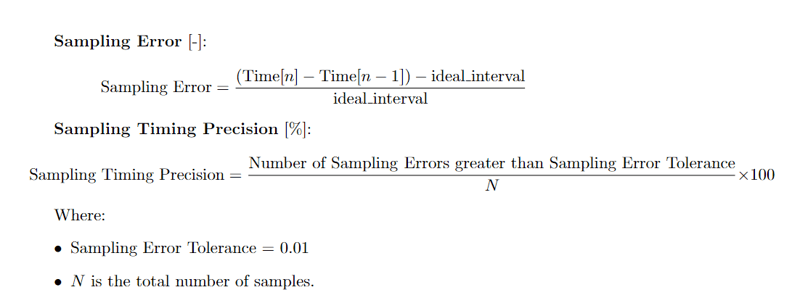
Rajah 10 dan 11 menggambarkan hubungan antara frekuensi pensampelan dan ketepatan masa pensampelan. Ketepatan masa pensampelan diwakili sebagai:

Menurut Rajah 10, BNO055 boleh bertindak balas kepada frekuensi pensampelan sehingga 50 Hz. Walau bagaimanapun, melebihi 60 Hz, ketepatan masa pensampelan menurun secara mendadak.

Rajah 11 menunjukkan bahawa ELM327 mempunyai tanggungjawab yang lebih rendah berbanding BNO055. ELM327 mengekalkan ketepatan masa pensampelan yang baik hanya sehingga 5 Hz. Ini kerana ELM327 berkomunikasi dengan kenderaan melalui OBD, dan ECU kenderaan mungkin tidak menyokong tindak balas frekuensi tinggi kepada permintaan OBD, mengakibatkan komunikasi frekuensi rendah.
Selain itu, ELM327 ialah pilihan paling murah dan berkualiti rendah di kalangan penderia yang boleh mendapatkan semula data daripada berbilang ECU dalam kenderaan melalui OBD-II.
Catatan ini★Mencabar angka kecekapan bahan api komputer perjalanan kereta anda[9] mengatakan bahawa
Satu perkara penting untuk dipertimbangkan dengan Elm327 ialah masa tindak balas adalah jauh daripada boleh diabaikan: peranti mungkin mengambil masa .1 hingga .3 saat untuk menjawab permintaan mesej, yang bermaksud bahawa penambahan terlalu banyak isyarat berakhir dengan cepat mengurangkan kadar pensampelan ke titik di mana ia mendapat kegunaan
Untuk nasihat yang lebih terperinci, lawati halaman ini:★Memilih penyesuai OBDII[10]
Mengenai punca prestasi rendah, sebab berikut boleh dipertimbangkan:
Perisian pengukuran yang telah saya bangunkan mengandaikan bahawa menggunakan kes yang diperlukan oleh berbilang penderia. Selain itu, pengguna boleh menukar tetapan ukuran pada fail yaml. Pengguna boleh mengendalikan aplikasi pengukuran pada GUI mudah. Anda boleh melihat kod sumber di sini: ★VDDM[11]
Struktur sistem pengukuran adalah di bawah:
VDDM/
│
├── fusion/
│   ├── __init__.py
│   ├── sensor_fusion.py   # Handles data fusion, collects data from sensors
│   └── sensors/
│       ├── __init__.py
│       ├── bno055_measurement.py   # Script for BNO055 sensor data collection
│       └── elm327_measurement.py   # Script for ELM327 OBD2 data collection
│
├── signalprocessing/
│   ├── __init__.py
│   └── filter.py           # Contains filtering algorithms (e.g., Butterworth filter)
│
├── config/
│   ├── config_manager.py    # Loads configuration from YAML
│   └── measurement_system_config.yaml   # Configuration file for sensors and system settings
│
├── utils/
│   ├── tools.py             # Utility functions (e.g., wait functions)
│   └── visualize_data.py    # Functions to format and display sensor data
│
├── measurement/
│   ├── __init__.py
│   └── measurement_control.py   # Controls the measurement process
│
├── gui/
│   ├── __init__.py
│   └── main_gui.py          # GUI setup for starting/stopping measurement
│
├── main.py                  # Entry point for starting the system
└── requirements.txt         # Project dependencies
Di bawah diaglam menunjukkan aliran VDDM.
main.py
  └── main_gui.py
        ├── Starts GUI interface and buttons
        └── measurement_control.py
              ├── Initializes sensor measurements
              ├── Controls start/stop of measurements
              └── sensor_fusion.py
                    ├── Manages sensor data collection and fusion
                    ├── Uses:
                    │    ├── bno055_measurement.py  (BNO055 sensor data collection)
                    │    └── elm327_measurement.py  (ELM327 OBD2 data collection)
                    └── Processes data with:
                         ├── filter.py  (Applies Butterworth low-pass filter)
                         └── visualize_data.py  (Formats and visualizes sensor data)
Komponen utama VDDM ialah VDDM/fusion/sensor_fusion.py, VDDM/fusion/sensors/bno055_measurement.py dan VDDM/fusion/sensors/elm327_measurement.py.
# sensor_fusion.py
import os
import sys
import importlib
from time import perf_counter
from collections import defaultdict
import pandas as pd
import datetime
import asyncio
import numpy as np


parent_dir = os.path.abspath(os.path.join(os.path.dirname(__file__), '..'))
sys.path.append(parent_dir)

from config import config_manager
from utils.tools import wait_process
from utils.visualize_data import format_sensor_fusion_data
from signalprocessing.filter import butterlowpass

config_path = os.path.join(parent_dir, 'config', 'measurement_system_config.yaml')


class SensorFactory:
    @staticmethod
    def create_sensor(sensor_type, config):
        try:
            # Import the appropriate sensor module based on sensor_type
            module = importlib.import_module(f"fusion.sensors.{sensor_type}_measurement")
            # Get a sensor class
            sensor_class = getattr(module, f"{sensor_type.upper()}")
            # Create a sensor instance and return
            return sensor_class(config)
        except (ImportError, AttributeError) as e:
            print(f"Error creating sensor {sensor_type}: {e}")
            return None


class Sensors:
    def __init__(self, config):
        self.config = config_manager.load_config(config_path)
        self.sensor_list = tuple(self.config.sensors.keys())
        self.sensor_instances = {}
        self.is_running = False


        self.SAMPLING_FREQUENCY_HZ = config.sampling_frequency_hz
        self.SAMPLING_TIME = 1 / self.SAMPLING_FREQUENCY_HZ
        self.SAVE_DATA_DIR = config.save_data_dir
        self.SAVE_BUF_CSVDATA_PATH = self.SAVE_DATA_DIR + "/" + "measurement_raw_data.csv"
        self.SEQUENCE_LENGTH = config.sequence_length # Windows size [s]
        # Buffer size is determined by the relation of sequence length and sampling frequency
        # Buffer secures data for SEQUENCE_LENGTH[s]
        self.MAX_DATA_BUF_LEN = self.SEQUENCE_LENGTH * self.SAMPLING_FREQUENCY_HZ
        self.FPASS = config.filter_params.fpass
        self.FSTOP = config.filter_params.fstop
        self.GPASS = config.filter_params.gpass
        self.GSTOP = config.filter_params.gstop
        self.is_filter = config.filter_params.is_filter
        self.is_show_real_time_data = config.is_show_real_time_data
        self.TIMEZONE = config.timezone
        self.all_data_columns_list = ()
        for sensor_name in self.sensor_list:
            self.all_data_columns_list += tuple(self.config["sensors"][sensor_name]["data_columns"])


        self.data_buffer = pd.DataFrame()  # data buffer

        for sensor_type in self.sensor_list:
            sensor_config = self.config.sensors[sensor_type]
            sensor_instance = SensorFactory.create_sensor(sensor_type, sensor_config)
            if sensor_instance:
                self.sensor_instances[sensor_type] = sensor_instance


        if os.path.exists(self.SAVE_BUF_CSVDATA_PATH):
            os.remove(self.SAVE_BUF_CSVDATA_PATH)
            print(f"File  '{self.SAVE_BUF_CSVDATA_PATH}' was deleted for initialization")


    def get_sensor(self, sensor_type):
        """
        Retrieve the sensor instance corresponding to the specified sensor type.

        Args:
            sensor_type (str): The type of the sensor to retrieve.

        Returns:
            object: The sensor instance corresponding to the specified sensor type.
                    Returns None if the sensor type does not exist.
        """
        return self.sensor_instances.get(sensor_type)

    def collect_data(self):
        """
        Collect data from all sensors.

        This method iterates over all sensor instances and collects data from each sensor.
        The collected data is stored in a dictionary where the keys are sensor types and
        the values are the data collected from the corresponding sensors.

        Returns:
            dict: A dictionary containing the collected data from all sensors.
                The keys are sensor types and the values are the data from each sensor.

        Raises:
            Exception: If an error occurs while collecting data from any sensor, the exception
                    is caught and printed.
        """
        data = {}
        try:
            for sensor_type, sensor in self.sensor_instances.items():
                # get data from sensors
                data[sensor_type] = sensor.get_data_from_sensor()
            return data
        except Exception as e:
            print(e)


    def on_change_start_measurement(self):
        """
        Start the measurement process.

        This method sets the is_running flag to True, indicating that the measurement
        process should start.
        """
        self.is_running = True

    def on_change_stop_measurement(self):
        """
        Stop the measurement process.

        This method sets the is_running flag to False, indicating that the measurement
        process should stop.
        """
        self.is_running = False


    def filtering(self, df, labellist):
        """
        Apply a low-pass filter to the specified columns in the DataFrame.

        This method applies a Butterworth low-pass filter to each column specified
        in the labellist. The "Time" column should be excluded from the labellist
        as it is not needed for the computation.

        Args:
            df (pd.DataFrame): The input DataFrame containing the data to be filtered.
            labellist (list of str): A list of column names to be filtered. The "Time"
                                     column should not be included in this list.

        Returns:
            pd.DataFrame: A new DataFrame with the filtered data.
        """
        filtered_df = df.copy()
        for labelname in labellist:
            # Ensure the column is converted to a numpy array
            x = df[labelname].to_numpy()
            filtered_df[labelname] = butterlowpass(
                x=x,  # Correctly pass the numpy array as 'x'
                fpass=self.FPASS,
                fstop=self.FSTOP,
                gpass=self.GPASS,
                gstop=self.GSTOP,
                fs=self.SAMPLING_FREQUENCY_HZ,
                dt=self.SAMPLING_TIME,
                checkflag=False,
                labelname=labelname
            )
        return filtered_df

    def convert_dictdata(self, current_time, sensor_data_dict):
        """
        Convert nested dictionary data from multiple sensors into a single DataFrame.

        This method converts nested dictionary data obtained from multiple sensors
        into a single dictionary and then converts it into a pandas DataFrame. The
        current_time information is associated with the data.

        Args:
            current_time (float): The current time at which the data was obtained.
            sensor_data_dict (dict): A nested dictionary containing data from multiple sensors.

        Returns:
            pd.DataFrame: A DataFrame containing the converted data with the current time information.
        """
        converted_data = {'Time': current_time}
        for sensor, data in sensor_data_dict.items():
            converted_data.update(data)

        converted_data = pd.DataFrame([converted_data])

        return converted_data


    async def update_data_buffer(self, dict_data):
        """
        Add data from sensors to the buffer and save it if necessary.

        This method adds the provided sensor data to the internal buffer. If the buffer
        exceeds the specified maximum length, the oldest data is saved to a CSV file
        and removed from the buffer.

        Args:
            dict_data (dict): The data from sensors to be added to the buffer.
        """

        # Add data to the buffer
        self.data_buffer = pd.concat([self.data_buffer, dict_data], ignore_index=True)

        # If the buffer exceeds the specified length, save the oldest data
        if len(self.data_buffer) > self.MAX_DATA_BUF_LEN:
            # Save the oldest data to a CSV file
            old_data = self.data_buffer.head(self.MAX_DATA_BUF_LEN)

            await self.save_data(old_data, self.SAVE_BUF_CSVDATA_PATH)

            # Update the buffer
            self.data_buffer = self.data_buffer.tail(len(self.data_buffer) - self.MAX_DATA_BUF_LEN)


    async def save_data_async(self, df, path):
        """
        Save the DataFrame to a CSV file asynchronously.

        This method uses asyncio.to_thread to run the synchronous to_csv method
        in a separate thread, allowing it to be handled asynchronously.

        Args:
            df (pd.DataFrame): The DataFrame to be saved.
            path (str): The file path where the DataFrame should be saved.
        """
        if not os.path.isfile(path):
            await asyncio.to_thread(df.to_csv, path, sep=',', encoding='utf-8', index=False, header=True, mode='w')
        else:
            await asyncio.to_thread(df.to_csv, path, sep=',', encoding='utf-8', index=False, header=False, mode='a')

    async def save_data(self, df, path):
        """
        Save the DataFrame to a CSV file asynchronously.

        This method calls save_data_async to save the DataFrame to a CSV file
        asynchronously.

        Args:
            df (pd.DataFrame): The DataFrame to be saved.
            path (str): The file path where the DataFrame should be saved.
        """
        await self.save_data_async(df, path)


    async def finish_measurement_and_save_data(self):
        """
        Finish the measurement process and save the data.

        This method finalizes the measurement process by saving the buffered data
        to a CSV file. It also applies filtering if specified and saves the filtered
        data to a separate CSV file. The method handles time zone settings and
        generates a timestamp for the file names.

        The buffered data is saved to a temporary CSV file, which is then read back
        and saved to a final file path with a timestamp. If filtering is enabled,
        the filtered data is also saved. The temporary CSV file is deleted after
        the data is saved.

        Raises:
            Exception: If an error occurs during the file operations.
        """
        t_delta = datetime.timedelta(hours=9)
        TIMEZONE = datetime.timezone(t_delta, self.TIMEZONE)# You have to set your timezone
        now = datetime.datetime.now(TIMEZONE)
        timestamp = now.strftime('%Y%m%d%H%M%S')
        final_file_path = self.SAVE_BUF_CSVDATA_PATH.replace(self.SAVE_BUF_CSVDATA_PATH.split('/')[-1],
                                                   timestamp + "/" + timestamp + '_' +
                                                   self.SAVE_BUF_CSVDATA_PATH.split('/')[-1])
        await self.save_data_async(self.data_buffer, self.SAVE_BUF_CSVDATA_PATH)
        raw_df = pd.read_csv(self.SAVE_BUF_CSVDATA_PATH, header=0)
        os.makedirs(self.SAVE_DATA_DIR + "/" + timestamp, exist_ok=True)
        raw_df.to_csv(final_file_path, sep=',', encoding='utf-8', index=False, header=True)


        if self.is_filter:
            filt_df = self.filtering(df=raw_df, labellist=raw_df.columns[1:])
            filt_df.to_csv(final_file_path.replace('_raw_data.csv', '_filt_data.csv'), sep=',', encoding='utf-8', index=False, header=True)

        if os.path.exists(self.SAVE_BUF_CSVDATA_PATH):
            os.remove(self.SAVE_BUF_CSVDATA_PATH)
            print(f"File  '{self.SAVE_BUF_CSVDATA_PATH}' was deleted")
        else:
            print(f"File '{self.SAVE_BUF_CSVDATA_PATH}' is not existed")


async def sensor_fusion_main():
    """
    Main function for sensor fusion.

    This function initializes the sensor fusion process, starts the measurement loop,
    collects data from multiple sensors, updates the data buffer, and handles real-time
    data display. It also calculates and prints the sampling delay and reliability rate
    upon termination.

    The main loop runs until the measurement process is stopped, either by an exception
    or a keyboard interrupt.

    Raises:
        Exception: If an error occurs during the measurement process, it is caught and printed.
        KeyboardInterrupt: If a keyboard interrupt occurs, the measurement process is stopped
                           and the data is saved.

    """
    print("Start sensor fusion main")
    config = config_manager.load_config(config_path)
    sensors = Sensors(config["master"])
    print("Called an instance of Sensors class")

    # sensors.start_all_measurements()
    sampling_counter = 0
    current_time = 0
    #sensors.is_running = True
    sensors.on_change_start_measurement()

    try:
        main_loop_start_time = None
        while sensors.is_running:
            iteration_start_time = perf_counter() # Start time of each iteration

            if main_loop_start_time is None:
                    main_loop_start_time = iteration_start_time  # initialize main loop start time

            current_time = perf_counter() - main_loop_start_time # Current time

            data = sensors.collect_data() # Get data from sensors
            sampling_counter += 1 # Num of sampling

            converted_data = sensors.convert_dictdata(current_time, data) # Convert data to dataframe format
            # Update the data buffer. If it reaches the buffer limit, write the data to a CSV file.
            await sensors.update_data_buffer(converted_data)
            # Display data in real time. This process is executed on additional thread.
            if sensors.is_show_real_time_data:
                formatted_data = format_sensor_fusion_data(data, sensors.all_data_columns_list)
                print("--------------------------------------------------------------------")
                print("Current Time is: {:.3f}".format(current_time))
                print(formatted_data)

            # Wait based on the sampling interval and execution time to maintain the sampling frequency.
            iteration_end_time = perf_counter()
            iteration_duration = iteration_end_time - iteration_start_time
            print("Iteration duration is: {0} [s]".format(iteration_duration))
            sleep_time = max(0, sensors.SAMPLING_TIME - iteration_duration)
            if sleep_time > 0:
                wait_process(sleep_time)

    except Exception as e:
        print(e)

    except KeyboardInterrupt:
        sensors.on_change_stop_measurement()
        print("KeyboardInterrupt")
        await sensors.finish_measurement_and_save_data()

    finally:
        print("finish")
         # Compute delay of sampling
        main_loop_end_time = perf_counter() - main_loop_start_time
        print("Program terminated")
        print("main loop is ended. current time is: {:.3f}".format(current_time))
        print("main loop is ended. end time is: {:.3f}".format(main_loop_end_time))
        print("sampling num is: {}".format(sampling_counter))


        # Compute ideal sampliing time
        ideal_time = ((sampling_counter - 1) / sensors.SAMPLING_FREQUENCY_HZ)
        # Cpmpute a delay
        delay_time = current_time - ideal_time
        # reliability rate
        sampling_reliability_rate = (delay_time / (sampling_counter / sensors.SAMPLING_FREQUENCY_HZ)) * 100


        print("sampling delay is: {:.3f} s".format(delay_time))
        print("sampling delay rate is: {:.3f} %".format(sampling_reliability_rate))


if __name__ == '__main__':
    asyncio.run(sensor_fusion_main())
sensor_fusion.py manages sensor data collection and processing using asynchronous operations. It dynamically creates sensor instances, collects data, applies filters, and saves the data to CSV files. The script also displays real-time data if needed and monitors performance metrics like sampling delay and reliability. The main function runs a loop that handles data collection, buffer updates, and performance reporting. It uses asynchronous operations to efficiently manage data saving and ensure smooth performance.
# bno055_measurement.py
import time
import numpy as np
import adafruit_bno055
import board
import os
import sys

parent_dir = os.path.abspath(os.path.join(os.path.dirname(__file__), '..', '..'))
sys.path.append(parent_dir)

from config.config_manager import load_config
config_path = os.path.join(parent_dir, 'config', 'measurement_system_config.yaml')


class BNO055:
    def __init__(self, config):
        self.COLUMNS = config.data_columns
        self.SAMPLING_FREQUENCY_HZ = config.sampling_frequency_hz
        self.SAMPLING_TIME = 1 / self.SAMPLING_FREQUENCY_HZ
        self.SAVE_DATA_DIR = config.save_data_dir
        self.SEQUENCE_LENGTH = config.sequence_length
        self.FPASS = config.filter_params.fpass
        self.FSTOP = config.filter_params.fstop
        self.GPASS = config.filter_params.gpass
        self.GSTOP = config.filter_params.gstop
        self.Isfilter = config.filter_params.is_filter

        self.IsStart = False
        self.IsStop = True
        self.Is_show_real_time_data = config.is_show_real_time_data

        i2c_instance = board.I2C() # Create i2c instance
        self.bno055_sensor = adafruit_bno055.BNO055_I2C(i2c_instance) # create BNO055_I2C instance

    def calibration(self):
        print("Start calibration!")
        while not self.bno055_sensor.calibrated:
            print('SYS: {0}, Gyro: {1}, Accel: {2}, Mag: {3}'.format(*(self.bno055_sensor.calibration_status)))
            time.sleep(1)


    def calcEulerfromQuaternion(self, _w, _x, _y, _z):
        """
        Calculate Euler angles (roll, pitch, yaw) from quaternion components.

        This method converts quaternion components (_w, _x, _y, _z) into Euler angles
        (roll, pitch, yaw) in degrees. If any of the quaternion components are None,
        it returns (0.0, 0.0, 0.0) and prints an error message.

        Args:
            _w (float): The w component of the quaternion.
            _x (float): The x component of the quaternion.
            _y (float): The y component of the quaternion.
            _z (float): The z component of the quaternion.

        Returns:
            tuple: A tuple containing the roll, pitch, and yaw angles in degrees.
                If an error occurs, it returns (0.0, 0.0, 0.0) and prints an error message.
        """
        if None in (_w, _x, _y, _z):
            print(f"Error: One or more quaternion values are None: {_w}, {_x}, {_y}, {_z}")
            return 0.0, 0.0, 0.0

        try:
            sqw = _w ** 2
            sqx = _x ** 2
            sqy = _y ** 2
            sqz = _z ** 2
            COEF_EULER2DEG = 57.2957795131

            # Yaw
            term1 = 2.0 * (_x * _y + _z * _w)
            term2 = sqx - sqy - sqz + sqw
            yaw = np.arctan2(term1, term2)

            # Pitch
            term1 = -2.0 * (_x * _z - _y * _w)
            term2 = sqx + sqy + sqz + sqw
            pitch = np.arcsin(term1 / term2) if -1 <= term1 / term2 <= 1 else 0.0

            # Roll
            term1 = 2.0 * (_y * _z + _x * _w)
            term2 = -sqx - sqy + sqz + sqw
            roll = np.arctan2(term1, term2)

            return COEF_EULER2DEG * roll, COEF_EULER2DEG * pitch, COEF_EULER2DEG * yaw

        except Exception as e:
            print(f"Error in calcEulerfromQuaternion: {e}")
            return 0.0, 0.0, 0.0

    def get_data_from_sensor(self):
        """
        Retrieve data from the BNO055 sensor and return it as a dictionary.

        This method collects various sensor readings from the BNO055 sensor, including
        Euler angles, gyroscope data, linear acceleration, quaternion, magnetic field,
        and calibration status. It then constructs a dictionary with these values and
        returns only the columns specified in self.COLUMNS.

        Returns:
            dict: A dictionary containing the sensor data. Only the columns specified
                in self.COLUMNS are included in the returned dictionary.
        """
        # Get data
        euler_z, euler_y, euler_x = [val for val in self.bno055_sensor.euler]  # X: yaw, Y: pitch, Z: roll
        gyro_x, gyro_y, gyro_z = [val for val in self.bno055_sensor.gyro]  # Gyro[rad/s]
        linear_accel_x, linear_accel_y, linear_accel_z = [val for val in self.bno055_sensor.linear_acceleration]  # Linear acceleration[m/s^2]
        quaternion_1, quaternion_2, quaternion_3, quaternion_4 = [val for val in self.bno055_sensor.quaternion]  # Quaternion
        quat_roll, quat_pitch, quat_yaw = self.calcEulerfromQuaternion(quaternion_1, quaternion_2, quaternion_3, quaternion_4)  # Cal Euler angle from quaternion
        magnetic_x, magnetic_y, magnetic_z = [val for val in self.bno055_sensor.magnetic]  # Magnetic field
        calibstat_sys, calibstat_gyro, calibstat_accel, calibstat_mag = [val for val in self.bno055_sensor.calibration_status]  # Status of calibration


        data_dict = {
            "linear_accel_x": linear_accel_x,
            "linear_accel_y": linear_accel_y,
            "linear_accel_z": linear_accel_z,
            "gyro_x": gyro_x,
            "gyro_y": gyro_y,
            "gyro_z": gyro_z,
            "euler_x": euler_x,
            "euler_y": euler_y,
            "euler_z": euler_z,
            "quat_roll": quat_roll,
            "quat_pitch": quat_pitch,
            "quat_yaw": quat_yaw,
            "quaternion_1": quaternion_1,
            "quaternion_2": quaternion_2,
            "quaternion_3": quaternion_3,
            "quaternion_4": quaternion_4,
            "magnetic_x": magnetic_x,
            "magnetic_y": magnetic_y,
            "magnetic_z": magnetic_z,
            "calibstat_sys": calibstat_sys,
            "calibstat_gyro": calibstat_gyro,
            "calibstat_accel": calibstat_accel,
            "calibstat_mag": calibstat_mag
        }

        return {column: data_dict[column] for column in self.COLUMNS if column in data_dict}


def format_sensor_data(data, labels):
    """
    Format sensor data into a string for display.

    This method takes a dictionary of sensor data and a list of labels, and formats
    the data into a string where each label is followed by its corresponding value.
    If a value is None, it is replaced with the string "None". Each label-value pair
    is separated by " / ".

    Args:
        data (dict): The sensor data to format.
        labels (list of str): The list of labels to include in the formatted string.

    Returns:
        str: A formatted string containing the sensor data.
    """
    formatted_str = ""
    if isinstance(data, dict):
        for label in labels:
            value = data.get(label, None)
            if value is None:
                value = "None"
            else:
                value = f"{value:.4f}"
            formatted_str += f"{label}: {value} / "
    return formatted_str.rstrip(" / ")

def test_main():
    """
    Main function for testing sensor data collection and display.

    This function initializes the BNO055 sensor, starts a loop to collect data,
    formats the data for display, and prints it in real-time. It also calculates
    and prints the sampling delay and reliability rate upon termination.

    The main loop runs until interrupted by the user.

    Raises:
        KeyboardInterrupt: If a keyboard interrupt occurs, the loop is terminated
                           and the final statistics are printed.
    """
    from utils.tools import wait_process
    from time import perf_counter
    import matplotlib.pyplot as plt

    print("Main start")

    config = load_config(config_path)
    meas_bno055 = BNO055(config.sensors['bno055'])

    start_time = perf_counter()
    sampling_counter = 0

    try:
        main_loop_start_time = perf_counter()
        while True:
            iteration_start_time = perf_counter()

            # Data acquisition process
            data = meas_bno055.get_data_from_sensor()
            current_time = perf_counter() - start_time
            sampling_counter += 1

            if meas_bno055.Is_show_real_time_data:
                formatted_data = format_sensor_data(data, meas_bno055.COLUMNS)
                # current time
                print("--------------------------------------------------------------------")
                print("Current Time is: {:.3f}".format(current_time))
                print(formatted_data)

            # Wait to meet the sampling frequency based on the sampling interval and execution time
            elapsed_time = perf_counter() - iteration_start_time
            sleep_time = meas_bno055.SAMPLING_TIME - elapsed_time
            if sleep_time > 0:
                wait_process(sleep_time)

    except KeyboardInterrupt:
        print("Interrupted by user")

    finally:
        # Calculate the sampling delay from the number of samples and the current time
        main_loop_end_time = perf_counter() - main_loop_start_time
        print("Program terminated")
        print("main loop is ended. current time is: {:.3f}".format(current_time))
        print("main loop is ended. end time is: {:.3f}".format(main_loop_end_time))
        print("sampling num is: {}".format(sampling_counter)) # Since it is 0-based, the number of samples is current_time + 1

        # Calculate the ideal sampling time
        ideal_time = ((sampling_counter - 1) / meas_bno055.SAMPLING_FREQUENCY_HZ)
        # Calculate the delay
        delay_time = current_time - ideal_time
        # The reliability rate is the delay divided by the sampling time
        sampling_reliability_rate = (delay_time / (sampling_counter / meas_bno055.SAMPLING_FREQUENCY_HZ)) * 100

        print("sampling delay is: {:.3f} s".format(delay_time))
        print("sampling delay rate is: {:.3f} %".format(sampling_reliability_rate))


if __name__ == '__main__':
    test_main()
This script interfaces with the BNO055 sensor to collect and process data. It retrieves sensor readings, such as Euler angles and gyroscope data, formats them for display, and prints real-time updates if configured. The script includes a calibration method and calculates Euler angles from quaternion data. It manages data acquisition with a defined sampling frequency and calculates sampling delay and reliability. The main loop continues until interrupted, reporting performance metrics upon termination.
# elm327_measurement.py

import obd
import os
import time
from collections import deque
import numpy as np
import pandas as pd
import datetime
import asyncio
import scipy
from scipy import signal
import matplotlib as plt
import sys
from collections import defaultdict
import random

parent_dir = os.path.abspath(os.path.join(os.path.dirname(__file__), '..', '..'))
sys.path.append(parent_dir)

from config.config_manager import load_config
config_path = os.path.join(parent_dir, 'config', 'measurement_system_config.yaml')

class ELM327:
    def __init__(self, config):
        """
        Initialize the ELM327 class with configuration parameters.

        Args:
            config (dict): Configuration parameters for the ELM327.
        """
        self.COLUMNS = config.data_columns
        self.SAMPLING_FREQUENCY_HZ = config.sampling_frequency_hz
        self.SAMPLING_TIME = 1 / self.SAMPLING_FREQUENCY_HZ
        self.SAVE_DATA_DIR = config.save_data_dir
        self.SEQUENCE_LENGTH = config.sequence_length
        self.FPASS = config.filter_params.fpass
        self.FSTOP = config.filter_params.fstop
        self.GPASS = config.filter_params.gpass
        self.GSTOP = config.filter_params.gstop
        self.Isfilter = config.filter_params.is_filter
        self.res = self.connect_to_elm327()

        self.is_offline = config.is_offline
        self.IsStart = False
        self.IsStop = True
        self.Is_show_real_time_data = config.is_show_real_time_data

    def initialize_BLE(self):
        """
        Initialize Bluetooth Low Energy (BLE) for ELM327 connection.
        """
        os.system('sudo hcitool scan')
        os.system('sudo hciconfig hci0 up')
        os.system('sudo rfcomm bind 0 8A:2A:D4:FF:38:F3')
        os.system('sudo rfcomm listen 0 1 &')

    def connect_to_elm327(self):
        """
        Establish a connection to the ELM327 device.

        Returns:
            res (obd.OBDStatus): The connection status of the ELM327 device.
        """
        res = None
        try:
            self.initialize_BLE()
            self.connection = obd.OBD()
            print(self.connection.status())
            res = self.connection.status()
            if res == obd.OBDStatus.CAR_CONNECTED:
                print("----------Connection establishment is successful!----------")
                return res
            else:
                print("----------Connection establishment failed!----------")
                print("End program. Please check settings of the computer and ELM327")
        except Exception as e:
            print("----------Exception!----------")
            print(e)
        finally:
            return res

    def get_data_from_sensor(self):
        """
        Retrieve data from the sensor.

        Returns:
            dict: A dictionary containing sensor data.
        """
        if self.is_offline:
            data = self.get_data_from_sensor_stub()
        else:
            # Retrieve data and save it in dictionary format
            data = {column: self.get_obd2_value(column) for column in self.COLUMNS}
        return data

    def get_obd2_value_debug(self, column):
        """
        Retrieve OBD-II value for a specific column with debug information.

        Args:
            column (str): The OBD-II command column.

        Returns:
            float or None: The value of the OBD-II command, or None if not available.
        """
        command = getattr(obd.commands, column, None)
        if command:
            response = self.connection.query(command)
            if response:
                print(f"Response for command '{command}': {response}")
                if response.value is not None:  # Check for None
                    print(f"Response value for command '{command}': {response.value}")
                    return response.value.magnitude
                else:
                    print(f"No value in response for command '{command}'")
            else:
                print(f"No response for command '{command}'")
        else:
            print(f"No command found for column '{column}'")
        return None

    def get_obd2_value(self, column):
        """
        Retrieve OBD-II value for a specific column.

        Args:
            column (str): The OBD-II command column.

        Returns:
            float or None: The value of the OBD-II command, or None if not available.
        """
        command = getattr(obd.commands, column, None)
        if command:
            response = self.connection.query(command)
            if response.value is not None:  # Check for None
                return response.value.magnitude
        return None

    def get_data_from_sensor_stub(self):
        """
        Generate stub data for the sensor.

        Returns:
            dict: A dictionary containing stub sensor data.
        """
        data_stub = {column: np.abs(np.random.randn()).astype(np.float32).item() for column in self.COLUMNS}
        # Randomly insert None or 0.0
        if random.choice([True, False]):
            random_column = random.choice(self.COLUMNS)
            if random.choice([True, False]):
                data_stub[random_column] = None
            else:
                data_stub[random_column] = 0.0

        return data_stub

def format_data_for_display(data, labels):
    """
    Format sensor data for display.

    Args:
        data (dict): The sensor data to format.
        labels (list of str): The list of labels to include in the formatted string.

    Returns:
        str: A formatted string containing the sensor data.
    """
    formatted_str = ""
    for label, value in zip(labels, data.values()):
        if value is None:
            value = "None"
        else:
            value = f"{value:.4f}"
        formatted_str += f"{label}: {value} / "
    return formatted_str.rstrip(" / ")

def format_sensor_data(data, labels):
    """
    Format sensor data for display.

    Args:
        data (dict or list): The sensor data to format.
        labels (list of str): The list of labels to include in the formatted string.

    Returns:
        str: A formatted string containing the sensor data.
    """
    formatted_str = ""
    if isinstance(data, dict):
        for label in labels:
            value = data.get(label, None)
            if value is None:
                value = "None"
            else:
                value = f"{value:.4f}"
            formatted_str += f"{label}: {value} / "
    else:
        for label, value in zip(labels, data):
            if value is None:
                value = "None"
            else:
                value = f"{value:.4f}"
            formatted_str += f"{label}: {value} / "
    return formatted_str.rstrip(" / ")

def test_main():
    """
    Main function for testing sensor data collection and display.

    This function initializes the ELM327 sensor, starts a loop to collect data,
    formats the data for display, and prints it in real-time. It also calculates
    and prints the sampling delay and reliability rate upon termination.

    The main loop runs until interrupted by the user.

    Raises:
        KeyboardInterrupt: If a keyboard interrupt occurs, the loop is terminated
                           and the final statistics are printed.
    """
    from utils.tools import wait_process
    from time import perf_counter
    import matplotlib.pyplot as plt

    print("Main start")
    config = load_config(config_path)
    meas_elm327 = ELM327(config.sensors['elm327'])
    # res = meas_elm327.connect_to_elm327()

    start_time = perf_counter()
    sampling_counter = 0
    try:
        main_loop_start_time = perf_counter()
        while True:
            iteration_start_time = perf_counter()

            # Data acquisition process
            data = meas_elm327.get_data_from_sensor()

            current_time = perf_counter() - start_time
            sampling_counter += 1

            if meas_elm327.Is_show_real_time_data:
                formatted_data = format_sensor_data(data, meas_elm327.COLUMNS)
                print("--------------------------------------------------------------------")
                print("Current Time is: {:.3f}".format(current_time))
                print(formatted_data)

            # Wait to meet the sampling frequency based on the sampling interval and execution time
            elapsed_time = perf_counter() - iteration_start_time
            sleep_time = meas_elm327.SAMPLING_TIME - elapsed_time
            if sleep_time > 0:
                wait_process(sleep_time)

    except KeyboardInterrupt:
        print("Interrupted by user")

    finally:
        main_loop_end_time = perf_counter() - main_loop_start_time
        print("Program terminated")
        print("main loop is ended. current time is: {:.3f}".format(current_time))
        print("main loop is ended. end time is: {:.3f}".format(main_loop_end_time))
        print("sampling num is: {}".format(sampling_counter))

        # Calculate the ideal sampling time
        ideal_time = ((sampling_counter - 1) / meas_elm327.SAMPLING_FREQUENCY_HZ)
        # Calculate the delay
        delay_time = current_time - ideal_time
        # The reliability rate is the delay divided by the sampling time
        sampling_reliability_rate = (delay_time / (sampling_counter / meas_elm327.SAMPLING_FREQUENCY_HZ)) * 100

        print("sampling delay is: {:.3f} s".format(delay_time))
        print("sampling delay rate is: {:.3f} %".format(sampling_reliability_rate))

if __name__ == '__main__':
    test_main()
This script defines an ELM327 class for interfacing with an ELM327 device to collect sensor data via OBD-II. It initializes the connection, retrieves data, and formats it for display. The test_main function sets up the ELM327 sensor, collects data in a loop, and prints it in real-time. It also calculates and displays sampling delay and reliability rates upon interruption. The script handles both real-time data acquisition and simulated offline data for testing purposes.
In this post, I described the project focused on developing a measurement system to capture vehicle behavior. While the project is still ongoing, I have recognized the potential for capturing vehicle data with a focus on the vehicle dynamics domain. However, when it comes to measuring signals from vehicle ECUs, some limitations need to be considered, as the ELM327 may not reliably achieve sampling rates beyond 5 Hz with good accuracy. This issue could likely be resolved by using a more advanced OBD scanner, such as the OBDLink MX+.
[1] Adafruit. "Adafruit BNO055 Absolute Orientation Sensor."
https://learn.adafruit.com/adafruit-bno055-absolute-orientation-sensor/overview. Accessed September 3, 2024.
[2] Adafruit. "Adafruit_CircuitPython_BNO055." https://github.com/adafruit/Adafruit_CircuitPython_BNO055. Accessed September 3, 2024.
[3] Adafruit. "Adafruit_BNO055." https://github.com/adafruit/Adafruit_BNO055. Accessed September 3, 2024.
[4] Adafruit. "Adafruit BNO055 Demo." https://cdn-shop.adafruit.com/product-videos/1024x768/2472-04.mp4 Accessed September 3, 2024.
[5] Amazon. "Elm327 Launchh OBD2 Professional Bluetooth Scan Tool and Code Reader for Android and PC, Interface OBDII OBD2 Car Auto Diagnostic Scanner, Not Support J1850 VPW & J1850 PWM". https://a.co/d/5BFn4GN. Accessed September 3, 2024.
[6] MathWorks. "Coordinate Systems in Automated Driving Toolbox." https://www.mathworks.com/help/driving/ug/coordinate-systems.html. Accessed September 3, 2024.
[7] Apple. "Getting raw gyroscope events." https://developer.apple.com/documentation/coremotion/getting_raw_gyroscope_events. Accessed September 3, 2024.
[8] phyphox. "phyphox top page."https://phyphox.org/. Accessed September 3, 2024.
[9] Andrea Patrucco, Vehicle dynamics engineer presso Applus+ IDIADA. "Challenging your car's trip computer fuel efficiency figures." https://www.linkedin.com/pulse/challenging-your-cars-trip-computer-fuel-efficiency-figures-patrucco/. Accessed September 3, 2024.
[10] "Choosing OBDII adapter". https://www.carscanner.info/choosing-obdii-adapter/. Accessed September 3, 2024.
[11] "VDDM". https://github.com/Qooniee/VDDM/tree/master/. Accessed September 3, 2024.
以上是使用 Raspberry Pi 构建用于车辆的自定义数据记录器:集成 BNO 和 ELM 传感器的详细内容。更多信息请关注PHP中文网其他相关文章!


