Matplotlib 中的子图与众多图重叠
在 Matplotlib 中生成一系列垂直堆叠图以在网页上显示时,确保子图之间适当的间距对于防止重叠至关重要。尽管增加了图形大小,但子图经常重叠。
当前实现
以下代码说明了当前实现:
import matplotlib.pyplot as plt
import my_other_module

titles, x_lists, y_lists = my_other_module.get_data()

fig = plt.figure(figsize=(10,60))
for i, y_list in enumerate(y_lists):
    plt.subplot(len(titles), 1, i)
    plt.xlabel("Some X label")
    plt.ylabel("Some Y label")
    plt.title(titles[i])
    plt.plot(x_lists[i],y_list)
fig.savefig('out.png', dpi=100)解决方案:紧密布局
要解决此问题,请考虑使用matplotlib.pyplot.tight_layout 或 matplotlib.figure.Figure.tight_layout。这些函数调整子图和间距,使它们不重叠。
示例
import matplotlib.pyplot as plt

fig, axes = plt.subplots(nrows=4, ncols=4, figsize=(8, 8))
fig.tight_layout() # Or equivalently,  "plt.tight_layout()"

plt.show()
视觉比较
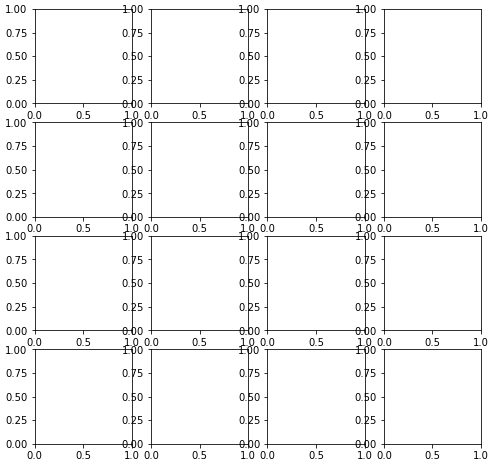
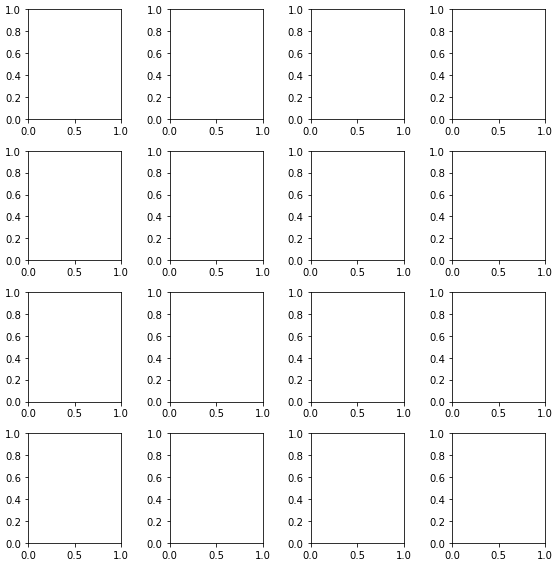
下图展示了使用的影响strict_layout:
不带ight_layout

有tight_layout

以上是创建许多垂直堆叠图时,如何防止 Matplotlib 中子图重叠?的详细内容。更多信息请关注PHP中文网其他相关文章!


