分割是图像分析中的一项基本技术,它允许我们根据对象、形状或颜色将图像划分为有意义的部分。它在物体检测、计算机视觉甚至艺术图像处理等应用中发挥着关键作用。但如何才能有效实现细分呢?幸运的是,OpenCV (cv2) 提供了几种用户友好且强大的分割方法。
在本教程中,我们将探讨三种流行的分割技术:
为了使本教程引人入胜且实用,我们将使用来自日本大阪的卫星和航空图像,重点关注古代古坟。您可以从教程的 GitHub 页面下载这些图像和相应的示例笔记本。
Canny 边缘检测是一种简单而强大的方法来识别图像中的边缘。它的工作原理是检测强度快速变化的区域,这些区域通常是物体的边界。该技术通过应用强度阈值生成“薄边缘”轮廓。让我们深入了解它使用 OpenCV 的实现。
示例:检测卫星图像中的边缘
在这里,我们使用大阪的卫星图像,特别是古坟,作为测试用例。
import cv2
import numpy as np
import matplotlib.pyplot as plt
files = sorted(glob("SAT*.png")) #Get png files
print(len(files))
img=cv2.imread(files[0])
use_image= img[0:600,700:1300]
gray = cv2.cvtColor(use_image, cv2.COLOR_BGR2GRAY)

#Stadard values
min_val = 100
max_val = 200
# Apply Canny Edge Detection
edges = cv2.Canny(gray, min_val, max_val)
#edges = cv2.Canny(gray, min_val, max_val,apertureSize=5,L2gradient = True )
False
# Show the result
plt.figure(figsize=(15, 5))
plt.subplot(131), plt.imshow(cv2.cvtColor(use_image, cv2.COLOR_BGR2RGB))
plt.title('Original Image'), plt.axis('off')
plt.subplot(132), plt.imshow(gray, cmap='gray')
plt.title('Grayscale Image'), plt.axis('off')
plt.subplot(133), plt.imshow(edges, cmap='gray')
plt.title('Canny Edges'), plt.axis('off')
plt.show()

输出边缘清晰地勾勒出古坟和其他感兴趣区域的部分轮廓。然而,由于阈值过大,一些区域被遗漏了。结果在很大程度上取决于 min_val 和 max_val 的选择以及图像质量。
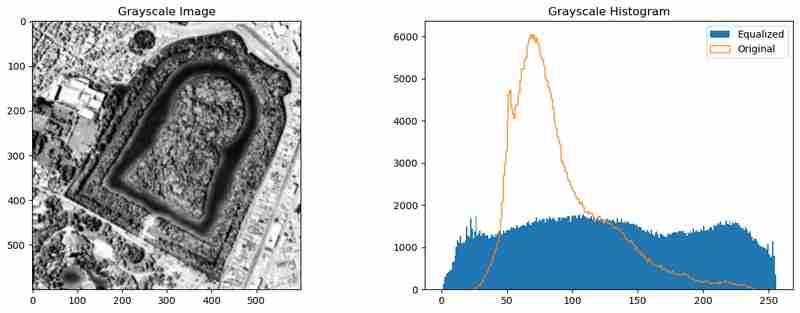
为了增强边缘检测,我们可以对图像进行预处理以分散像素强度并减少噪声。这可以使用直方图均衡 (cv2.equalizeHist()) 和高斯模糊 (cv2.GaussianBlur()) 来实现。
use_image= img[0:600,700:1300]
gray = cv2.cvtColor(use_image, cv2.COLOR_BGR2GRAY)
gray_og = gray.copy()
gray = cv2.equalizeHist(gray)
gray = cv2.GaussianBlur(gray, (9, 9),1)

plt.figure(figsize=(15, 5))
plt.subplot(121), plt.imshow(gray, cmap='gray')
plt.title('Grayscale Image')
plt.subplot(122)
_= plt.hist(gray.ravel(), 256, [0,256],label="Equalized")
_ = plt.hist(gray_og.ravel(), 256, [0,256],label="Original",histtype='step')
plt.legend()
plt.title('Grayscale Histogram')

这种预处理可以均匀强度分布并平滑图像,这有助于 Canny 边缘检测算法捕获更有意义的边缘。
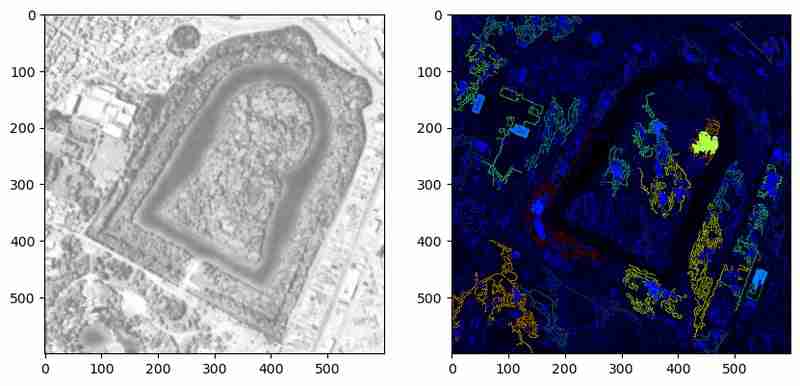
边缘很有用,但它们仅表示边界。为了分割封闭区域,我们将边缘转换为轮廓并可视化它们。
# Edges to contours
contours, hierarchy = cv2.findContours(edges, cv2.RETR_TREE, cv2.CHAIN_APPROX_SIMPLE)
# Calculate contour areas
areas = [cv2.contourArea(contour) for contour in contours]

# Normalize areas for the colormap
normalized_areas = np.array(areas)
if normalized_areas.max() > 0:
    normalized_areas = normalized_areas / normalized_areas.max()

# Create a colormap
cmap = plt.cm.jet

# Plot the contours with the color map
plt.figure(figsize=(10, 10))
plt.subplot(1,2,1)
plt.imshow(gray, cmap='gray', alpha=0.5)  # Display the grayscale image in the background
mask = np.zeros_like(use_image)
for contour, norm_area in zip(contours, normalized_areas):
    color = cmap(norm_area)  # Map the normalized area to a color
    color = [int(c*255) for c in color[:3]]
    cv2.drawContours(mask, [contour], -1, color,-1 )  # Draw contours on the image

plt.subplot(1,2,2)

上述方法用代表其相对区域的颜色突出显示检测到的轮廓。这种可视化有助于验证轮廓是否形成封闭体或仅形成线条。然而,在此示例中,许多轮廓仍然是未闭合的多边形。进一步的预处理或参数调整可以解决这些限制。
通过结合预处理和轮廓分析,Canny 边缘检测成为识别图像中对象边界的强大工具。然而,当对象定义明确且噪声最小时,它的效果最佳。接下来,我们将探索 K 均值聚类以按颜色分割图像,从而为相同数据提供不同的视角。
K-Means 聚类是数据科学中一种流行的方法,用于将相似的项目分组为聚类,并且它对于基于颜色相似性的图像分割特别有效。 OpenCV 的 cv2.kmeans 函数简化了此过程,使其可以执行对象分割、背景去除或视觉分析等任务。
在本节中,我们将使用 K 均值聚类将古坟墓图像分割为相似颜色的区域。
首先,我们对图像的 RGB 值应用 K 均值聚类,将每个像素视为一个数据点。
import cv2
import numpy as np
import matplotlib.pyplot as plt
files = sorted(glob("SAT*.png")) #Get png files
print(len(files))
img=cv2.imread(files[0])
use_image= img[0:600,700:1300]
gray = cv2.cvtColor(use_image, cv2.COLOR_BGR2GRAY)

#Stadard values
min_val = 100
max_val = 200
# Apply Canny Edge Detection
edges = cv2.Canny(gray, min_val, max_val)
#edges = cv2.Canny(gray, min_val, max_val,apertureSize=5,L2gradient = True )
False
# Show the result
plt.figure(figsize=(15, 5))
plt.subplot(131), plt.imshow(cv2.cvtColor(use_image, cv2.COLOR_BGR2RGB))
plt.title('Original Image'), plt.axis('off')
plt.subplot(132), plt.imshow(gray, cmap='gray')
plt.title('Grayscale Image'), plt.axis('off')
plt.subplot(133), plt.imshow(edges, cmap='gray')
plt.title('Canny Edges'), plt.axis('off')
plt.show()

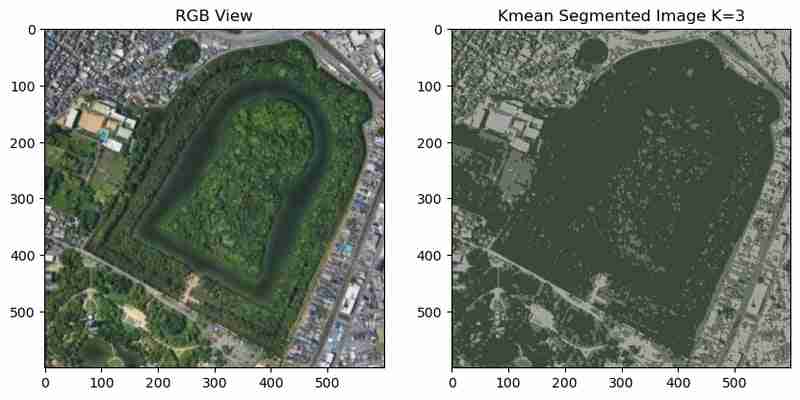
在分割图像中,古坟和周围区域聚集成不同的颜色。然而,噪声和颜色的微小变化会导致簇分散,这会给解释带来挑战。
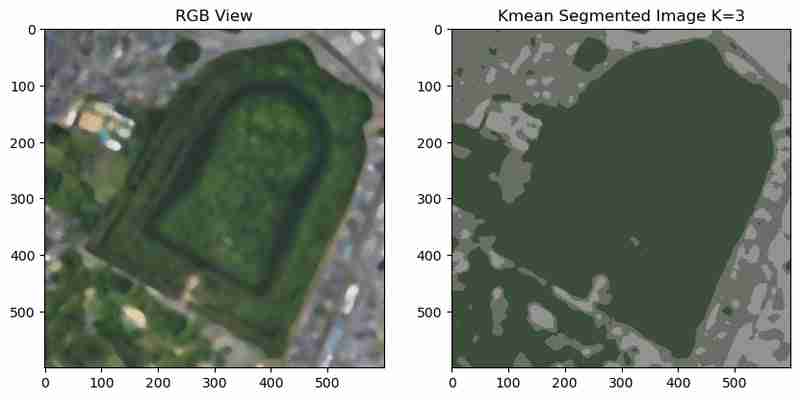
为了减少噪音并创建更平滑的聚类,我们可以在运行 K-Means 之前应用中值模糊。
use_image= img[0:600,700:1300]
gray = cv2.cvtColor(use_image, cv2.COLOR_BGR2GRAY)
gray_og = gray.copy()
gray = cv2.equalizeHist(gray)
gray = cv2.GaussianBlur(gray, (9, 9),1)

plt.figure(figsize=(15, 5))
plt.subplot(121), plt.imshow(gray, cmap='gray')
plt.title('Grayscale Image')
plt.subplot(122)
_= plt.hist(gray.ravel(), 256, [0,256],label="Equalized")
_ = plt.hist(gray_og.ravel(), 256, [0,256],label="Original",histtype='step')
plt.legend()
plt.title('Grayscale Histogram')

模糊的图像会产生更平滑的簇,减少噪音并使分割区域在视觉上更具凝聚力。
为了更好地理解分割结果,我们可以使用 matplotlib plt.fill_ Between;
创建独特簇颜色的颜色图
# Edges to contours
contours, hierarchy = cv2.findContours(edges, cv2.RETR_TREE, cv2.CHAIN_APPROX_SIMPLE)
# Calculate contour areas
areas = [cv2.contourArea(contour) for contour in contours]

# Normalize areas for the colormap
normalized_areas = np.array(areas)
if normalized_areas.max() > 0:
    normalized_areas = normalized_areas / normalized_areas.max()

# Create a colormap
cmap = plt.cm.jet

# Plot the contours with the color map
plt.figure(figsize=(10, 10))
plt.subplot(1,2,1)
plt.imshow(gray, cmap='gray', alpha=0.5)  # Display the grayscale image in the background
mask = np.zeros_like(use_image)
for contour, norm_area in zip(contours, normalized_areas):
    color = cmap(norm_area)  # Map the normalized area to a color
    color = [int(c*255) for c in color[:3]]
    cv2.drawContours(mask, [contour], -1, color,-1 )  # Draw contours on the image

plt.subplot(1,2,2)

这种可视化可以深入了解图像中的主色及其相应的 RGB 值,这对于进一步分析非常有用。因为我们现在可以屏蔽并选择我的颜色代码区域。
簇的数量 (K) 显着影响结果。增加 K 会创建更详细的细分,而较低的值会产生更广泛的分组。为了进行实验,我们可以迭代多个 K 值。
import cv2
import numpy as np
import matplotlib.pyplot as plt
files = sorted(glob("SAT*.png")) #Get png files
print(len(files))
img=cv2.imread(files[0])
use_image= img[0:600,700:1300]
gray = cv2.cvtColor(use_image, cv2.COLOR_BGR2GRAY)

#Stadard values
min_val = 100
max_val = 200
# Apply Canny Edge Detection
edges = cv2.Canny(gray, min_val, max_val)
#edges = cv2.Canny(gray, min_val, max_val,apertureSize=5,L2gradient = True )
False
# Show the result
plt.figure(figsize=(15, 5))
plt.subplot(131), plt.imshow(cv2.cvtColor(use_image, cv2.COLOR_BGR2RGB))
plt.title('Original Image'), plt.axis('off')
plt.subplot(132), plt.imshow(gray, cmap='gray')
plt.title('Grayscale Image'), plt.axis('off')
plt.subplot(133), plt.imshow(edges, cmap='gray')
plt.title('Canny Edges'), plt.axis('off')
plt.show()

不同 K 值的聚类结果揭示了细节和简单性之间的权衡:
・较低的 K 值(例如 2-3):聚类范围广泛,区分清晰,适合高级分割。
・更高的 K 值(例如 12-15):更详细的分割,但代价是增加复杂性和潜在的过度分割。
K-Means 聚类是一种基于颜色相似性分割图像的强大技术。通过正确的预处理步骤,它可以生成清晰且有意义的区域。然而,其性能取决于 K 的选择、输入图像的质量以及所应用的预处理。接下来,我们将探索分水岭算法,该算法利用地形特征来实现对象和区域的精确分割。
分水岭算法的灵感来自地形图,其中分水岭划分流域。此方法将灰度强度值视为高程,有效地创建“峰”和“谷”。通过识别感兴趣区域,该算法可以分割具有精确边界的对象。它对于分离重叠对象特别有用,使其成为细胞分割、对象检测和区分密集特征等复杂场景的绝佳选择。
第一步是预处理图像以增强特征,然后应用分水岭算法。
use_image= img[0:600,700:1300]
gray = cv2.cvtColor(use_image, cv2.COLOR_BGR2GRAY)
gray_og = gray.copy()
gray = cv2.equalizeHist(gray)
gray = cv2.GaussianBlur(gray, (9, 9),1)

plt.figure(figsize=(15, 5))
plt.subplot(121), plt.imshow(gray, cmap='gray')
plt.title('Grayscale Image')
plt.subplot(122)
_= plt.hist(gray.ravel(), 256, [0,256],label="Equalized")
_ = plt.hist(gray_og.ravel(), 256, [0,256],label="Original",histtype='step')
plt.legend()
plt.title('Grayscale Histogram')
分段区域和边界可以与中间处理步骤一起可视化。

# Edges to contours
contours, hierarchy = cv2.findContours(edges, cv2.RETR_TREE, cv2.CHAIN_APPROX_SIMPLE)
# Calculate contour areas
areas = [cv2.contourArea(contour) for contour in contours]

# Normalize areas for the colormap
normalized_areas = np.array(areas)
if normalized_areas.max() > 0:
    normalized_areas = normalized_areas / normalized_areas.max()

# Create a colormap
cmap = plt.cm.jet

# Plot the contours with the color map
plt.figure(figsize=(10, 10))
plt.subplot(1,2,1)
plt.imshow(gray, cmap='gray', alpha=0.5)  # Display the grayscale image in the background
mask = np.zeros_like(use_image)
for contour, norm_area in zip(contours, normalized_areas):
    color = cmap(norm_area)  # Map the normalized area to a color
    color = [int(c*255) for c in color[:3]]
    cv2.drawContours(mask, [contour], -1, color,-1 )  # Draw contours on the image

plt.subplot(1,2,2)
该算法成功识别不同的区域并在对象周围绘制清晰的边界。在本例中,古坟被精确分割。然而,该算法的性能在很大程度上取决于阈值处理、噪声去除和形态学操作等预处理步骤。
添加高级预处理,例如直方图均衡或自适应模糊,可以进一步增强结果。例如:
# Kmean color segmentation
use_image= img[0:600,700:1300]
#use_image = cv2.medianBlur(use_image, 15)


 # Reshape image for k-means
pixel_values = use_image.reshape((-1, 3)) if len(use_image.shape) == 3 else use_image.reshape((-1, 1))
pixel_values = np.float32(pixel_values)

criteria = (cv2.TERM_CRITERIA_EPS + cv2.TERM_CRITERIA_MAX_ITER, 10, 1.0)
K = 3
attempts=10
ret,label,center=cv2.kmeans(pixel_values,K,None,criteria,attempts,cv2.KMEANS_PP_CENTERS)

centers = np.uint8(center)
segmented_data = centers[label.flatten()]
segmented_image = segmented_data.reshape(use_image.shape)

plt.figure(figsize=(10, 6))
plt.subplot(1,2,1),plt.imshow(use_image[:,:,::-1])
plt.title("RGB View")
plt.subplot(1,2,2),plt.imshow(segmented_image[:,:,[2,1,0]])
plt.title(f"Kmean Segmented Image K={K}")

通过这些调整,可以准确分割更多区域,并最大限度地减少噪声伪影。
分水岭算法在需要精确边界划分和重叠对象分离的场景中表现出色。通过利用预处理技术,它甚至可以有效地处理像古坟古坟区域这样的复杂图像。然而,它的成功取决于仔细的参数调整和预处理。
分割是图像分析中的重要工具,提供了隔离和理解图像中不同元素的途径。本教程演示了三种强大的分割技术:Canny 边缘检测、K 均值聚类和分水岭算法,每种技术都是针对特定应用程序量身定制的。从勾勒出大阪古代古坟的轮廓,到聚类城市景观和划分不同区域,这些方法凸显了 OpenCV 在应对现实世界挑战方面的多功能性。
现在去将其中的一些方法应用到您选择的应用程序中,并发表评论并分享结果。另外,如果您知道任何其他简单的分割方法,也请分享
以上是[Python-CV图像分割:Canny边缘、分水岭和K-Means方法的详细内容。更多信息请关注PHP中文网其他相关文章!


