

echart插件等基本使用介绍
这篇文章主要介绍了echart简介,小编觉得挺不错的,现在分享给大家,也给大家做个参考。一起跟随小编过来看看吧
1. 插件的下载
以下是ECharts的下载链接,需要注意的是ECharts内部也是依赖于另一个插件的叫ZRender,当然对于大部分图表而言不需要ZRender的,但是对于地图控件及其他复杂的呈现控件而已都是需要ZRender的。为了避免不要的问题出现,建议大家在下载ECharts时同时也要下载ZRender。
ECharts下载地址: http://echarts.baidu.com/
ZRender下载地址:http://ecomfe.github.io/zrender/index.html
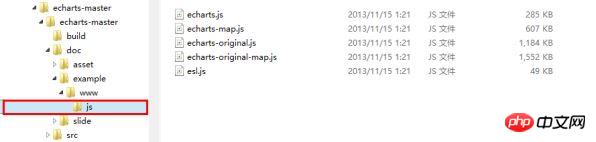
下载之后解压各自的文件目录结构如下:
ECharts:
ZRender:

2. 插件的引用
首先,新建一个Web应用程序,然后添加刚刚下载的文件,具体的目录结构如下:

这里有以下几点需要说明:
所有的跟ECharts有关的文件全部都在echarts文件夹下
echarts文件夹的内容分为两部分
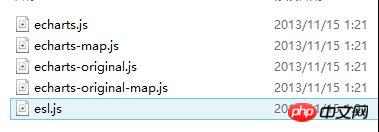
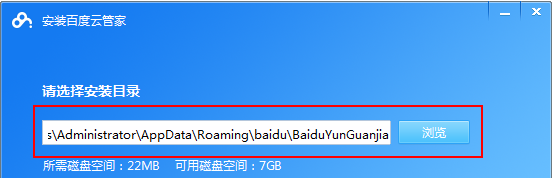
1) 一部分是以echarts开头的js文件,这些文件全部来自于1.中的ECharts文件目录中的js文件夹下的文件,也就是1.中的图中红框标注的js下的文件。如下:
2)另一部分是一个名为zrender的文件夹,这里需要特别注意的是该文件夹的命名必须为zrender,因为在echarts的js文件中对zrender的引用都是以zrender为根目录的,zrender文件夹的内容即为1.中zrender文件目录中的src文件夹下的内容,如下:

3. 在页面中的具体使用
按照上边的步骤配置过之后,我们就可以在页面中引用了,这里我主要是演示地图控件的使用方式,因为地图的引用跟其他的基本图形的引用不太一样。其他的图形的呈现也会做一个简要的演示。
MapChart
首先在跟2中的echarts文件夹同一个目录(也就是Modules文件夹)下添加一个aspx页或html页,需要注意的是,如果是在aspx页中使用echarts时,需要把要渲染的p放在form标签之外,否则图形是显示不出来的。
在head标签中添加对echarts的引用如下:
<head runat="server">
  <title></title>
  <script src="echarts/esl.js" type="text/javascript"></script>
</head>
在body标记中,form标记之外,添加一个p,用来做图表渲染的容器。如下:
<body>

<p id="main"style="height:500px;border:1px solid #ccc;padding:10px;"></p>

……………

……………

</body>
在上面中添加的p标记下,添加如下的js代码段,如下:
<script type="text/javascript">
//为模块加载器配置echarts的路径,这里主要是配置map图表的路径,其他的图表跟map的配置还不太一样,下边也会做另一种类型的图表事例。
这里引用的主要是echarts文件夹下的echarts-map文件,而其他类型的图表引用的都是echarts文件夹下的echarts文件。
require.config({
paths: {
echarts:'./echarts/echarts',
'echarts/chart/map':'./echarts/echarts-map'
}
});
//动态加载echarts,在回掉函数中使用,要注意保持按需加载结构定义图表路径
require(
[
'echarts',
'echarts/chart/map'
],
function (ec) {
varmyChart=ecinit(documentgetElementById('main'));
//option主要是图标的一些设置,这不是这篇文章的重点,关于具体的设置可以参考官方的文档说明文档
option= {
title: {
text:'iphone销量',
subtext:'纯属虚构',
x:'center'
},
tooltip: {
trigger:'item'
},
legend: {
orient:'vertical',
x:'left',
data: ['iphone3','iphone4','iphone5']
},
dataRange: {
min:0,
max:2500,
text: ['高','低'],
calculable:true,
textStyle: {
color:'orange'
}
},
toolbox: {
show:true,
orient:'vertical',
x:'right',
y:'center',
feature: {
mark:true,
dataView: { readOnly:false },
restore:true,
saveAsImage:true
}
},
series: [
{
name:'iphone3',
type:'map',
mapType:'china',
selectedMode: 'single',
itemStyle: {
normal: { label: { show:true },color:'#ffd700' },// for legend
emphasis: { label: { show:true} }
},
data: [
{ name:'北京',value:Math.round(Math.random() *1000) },
{ name:'天津',value:Math.round(Math.random() *1000) },
{ name:'上海',value:Math.round(Math.random() *1000) },
{ name:'重庆',value:Math.round(Math.random() *1000) },
{ name:'河北',value:Math.round(Math.random() *1000) },
{ name:'河南',value:Math.round(Math.random() *1000) },
{ name:'云南',value:Math.round(Math.random() *1000) },
{ name:'辽宁',value:Math.round(Math.random() *1000) },
{ name:'黑龙江',value:Math.round(Math.random() *1000) },
{ name:'湖南',value:Math.round(Math.random() *1000) },
{ name:'安徽',value:Math.round(Math.random() *1000) },
{ name:'山东',value:Math.round(Math.random() *1000) },
{ name:'新疆',value:Math.round(Math.random() *1000) },
{ name:'江苏',value:Math.round(Math.random() *1000) },
{ name:'浙江',value:Math.round(Math.random() *1000) },
{ name:'江西',value:Math.round(Math.random() *1000) },
{ name:'湖北',value:Math.round(Math.random() *1000) },
{ name:'广西',value:Math.round(Math.random() *1000) },
{ name:'甘肃',value:Math.round(Math.random() *1000) },
{ name:'山西',value:Math.round(Math.random() *1000) },
{ name:'内蒙古',value:Math.round(Math.random() *1000) },
{ name:'陕西',value:Math.round(Math.random() *1000) },
{ name:'吉林',value:Math.round(Math.random() *1000) },
{ name:'福建',value:Math.round(Math.random() *1000) },
{ name:'贵州',value:Math.round(Math.random() *1000) },
{ name:'广东',value:Math.round(Math.random() *1000) },
{ name:'青海',value:Math.round(Math.random() *1000) },
{ name:'西藏',value:Math.round(Math.random() *1000) },
{ name:'四川',value:Math.round(Math.random() *1000) },
{ name:'宁夏',value:Math.round(Math.random() *1000) },
{ name:'海南',value:Math.round(Math.random() *1000) },
{ name:'台湾',value:Math.round(Math.random() *1000) },
{ name:'香港',value:Math.round(Math.random() *1000) },
{ name:'澳门',value:Math.round(Math.random() *1000) }
]
},
{
name:'iphone4',
type:'map',
mapType:'china',
selectedMode: 'single',
itemStyle: {
normal: { label: { show:true },color:'#ff8c00' },// for legend
emphasis: { label: { show:true} }
},
data: [
{ name:'北京',value:Math.round(Math.random() *1000) },
{ name:'天津',value:Math.round(Math.random() *1000) },
{ name:'上海',value:Math.round(Math.random() *1000) },
{ name:'重庆',value:Math.round(Math.random() *1000) },
{ name:'河北',value:Math.round(Math.random() *1000) },
{ name:'安徽',value:Math.round(Math.random() *1000) },
{ name:'新疆',value:Math.round(Math.random() *1000) },
{ name:'浙江',value:Math.round(Math.random() *1000) },
{ name:'江西',value:Math.round(Math.random() *1000) },
{ name:'山西',value:Math.round(Math.random() *1000) },
{ name:'内蒙古',value:Math.round(Math.random() *1000) },
{ name:'吉林',value:Math.round(Math.random() *1000) },
{ name:'福建',value:Math.round(Math.random() *1000) },
{ name:'广东',value:Math.round(Math.random() *1000) },
{ name:'西藏',value:Math.round(Math.random() *1000) },
{ name:'四川',value:Math.round(Math.random() *1000) },
{ name:'宁夏',value:Math.round(Math.random() *1000) },
{ name:'香港',value:Math.round(Math.random() *1000) },
{ name:'澳门',value:Math.round(Math.random() *1000) }
]
},
{
name:'iphone5',
type:'map',
mapType:'china',
selectedMode: 'single',
itemStyle: {
normal: { label: { show:true },color:'#da70d6' },// for legend
emphasis: { label: { show:true} }
},
data: [
{ name:'北京',value:Math.round(Math.random() *1000) },
{ name:'天津',value:Math.round(Math.random() *1000) },
{ name:'上海',value:Math.round(Math.random() *1000) },
{ name:'广东',value:Math.round(Math.random() *1000) },
{ name:'台湾',value:Math.round(Math.random() *1000) },
{ name:'香港',value:Math.round(Math.random() *1000) },
{ name:'澳门',value:Math.round(Math.random() *1000) }
]
}
]
};
//以下的这段代码主要是用来处理用户的选择,应用场景是可以做地图的交互,比如点击地图上的某一个省,获取相应的省的指标变化等。
//需要特别注意的是,如果需要点击某一省作地图的操作交互的话,还需要为series属性的每一项添加一个selectedMode属性,这里的属性值为 'single'即单选,也可多选
varecConfig= require('echarts/config');
myChart.on(ecConfig.EVENT.MAP_SELECTED,function (param) {
varselected=param.selected;
varmapSeries=option.series[0];
vardata= [];
varlegendData= [];
varname;
for (varp=0,len=mapSeries.data.length; p<len; p++) {
name=mapSeries.data[p].name;
mapSeries.data[p].selected=selected[name];
if (selected[name]) {
alert(name); //这里只是简单的做一个事例说明,弹出用户所选的省,如需做其他的扩展,可以在这里边添加相应的操作
}
}
});
myChart.setOption(option);
}
);
</script>完成以上操作之后,效果如下图所示:

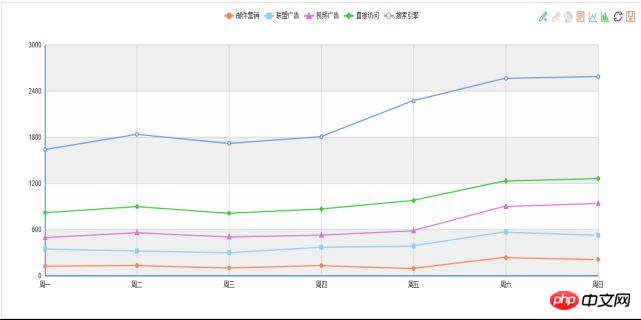
LineChart
除了地图图表之外的其他的图标的使用方式都差不多。事实上其他的图表跟地图图表的区别在于对配置文件的引用。这里只做一个折线图的示例,其它的示例都是一样的。
<scripttype="text/javascript">
require.config({
paths: {
echarts:'./echarts/echarts',
'echarts/chart/bar':'./echarts/echarts',//这里需要注意的是除了mapchart使用的配置文件为echarts-map之外,
其他的图形引用的配置文件都为echarts,这也是一般的图形跟地图的区别
'echarts/chart/line':'./echarts/echarts'
}
});
require(
[
'echarts',
'echarts/chart/bar',
'echarts/chart/line'
],
function (ec) {
varmyChart=ecinit(documentgetElementById('main'));
option= {
tooltip: {
trigger:'axis'
},
legend: {
data: ['邮件营销','联盟广告','视频广告','直接问','搜索引擎']
},
toolbox: {
show:true,
feature: {
mark:true,
dataView: { readOnly:false },
magicType: ['line','bar'],
restore:true,
saveAsImage:true
}
},
calculable:true,
xAxis: [
{
type:'category',
boundaryGap:false,
data: ['周一','周二','周三','周四','周五','周六','周日']
}
],
yAxis: [
{
type:'value',
splitArea: { show:true }
}
],
series: [
{
name:'邮件营销',
type:'line',
stack:'总量',
data: [120,132,101,134,90,230,210]
},
{
name:'联盟广告',
type:'line',
stack:'总量',
data: [220,182,191,234,290,330,310]
},
{
name:'视频广告',
type:'line',
stack:'总量',
data: [150,232,201,154,190,330,410]
},
{
name:'直接访问',
type:'line',
stack:'总量',
data: [320,332,301,334,390,330,320]
},
{
name:'搜索引擎',
type:'line',
stack:'总量',
data: [820,932,901,934,1290,1330,1320]
}
]
};
myChart.setOption(option);
}
);
</script>
<pid="main1"style="height:500px;border:1px solid #ccc;padding:10px;"></p>
<scripttype="text/javascript">
require.config({
paths: {
echarts:'./echarts/echarts',
'echarts/chart/bar':'./echarts/echarts',
'echarts/chart/line':'./echarts/echarts'
}
});
require(
[
'echarts',
'echarts/chart/bar',
'echarts/chart/line'
],
function (ec) {
varmyChart=ecinit(documentgetElementById('main1'));
option= {
title: {
text:'未来一周气温变化',
subtext:'纯属虚构'
},
tooltip: {
trigger:'axis'
},
legend: {
data: ['最高气温'最低气温']
},
toolbox: {
show:true,
feature: {
mark:true,
dataView: { readOnly:false },
magicType: ['line','bar'],
restore:true,
saveAsImage:true
}
},
calculable:true,
xAxis: [
{
type:'category',
boundaryGap:false,
data: ['周一','周二','周三','周四','周五','周六','周日']
}
],
yAxis: [
{
type:'value',
axisLabel: {
formatter:'{value} '
},
splitArea: { show:true }
}
],
series: [
{
name:'最高气温',
type:'line',
itemStyle: {
normal: {
lineStyle: {
shadowColor:'rgba(0,0,0,4)'
}
}
},
data: [11,11,15,13,12,13,10]
},
{
name:'最低气温',
type:'line',
itemStyle: {
normal: {
lineStyle: {
shadowColor:'rgba(0,0,0,4)'
}
}
},
data: [-2,1,2,5,3,2,0]
}
]
};
myChart.setOption(option);
}
);
</script>
<pid="main2"style="height:500px;border:1px solid #ccc;padding:10px;"></p>
<scripttype="text/javascript">
require.config({
paths: {
echarts:'./echarts/echarts',
'echarts/chart/bar':'./echarts/echarts',
'echarts/chart/line':'./echarts/echarts'
}
});
require(
[
'echarts',
'echarts/chart/bar',
'echarts/chart/line'
],
function (ec) {
varmyChart=ec.init(document.getElementById('main2'));
option= {
title: {
text:'某楼盘销售情况',
subtext:'纯属虚构'
},
tooltip: {
trigger:'axis'
},
legend: {
data: ['意向','预购','成交']
},
toolbox: {
show:true,
feature: {
mark:true,
dataView: { readOnly:false },
magicType: ['line','bar'],
restore:true,
saveAsImage:true
}
},
calculable:true,
xAxis: [
{
type:'category',
boundaryGap:false,
data: ['周','周二','周三','周四','周五','周六','周日']
}
],
yAxis: [
{
type:'value'
}
],
series: [
{
name:'成交',
type:'line',
smooth:true,
itemStyle: { normal: { areaStyle: { type:'default'}} },
data: [10,12,21,54,260,830,710]
},
{
name:'预购',
type:'line',
smooth:true,
itemStyle: { normal: { areaStyle: { type:'default'}} },
data: [30,182,434,791,390,30,10]
},
{
name:'意向',
type:'line',
smooth:true,
itemStyle: { normal: { areaStyle: { type:'default'}} },
data: [1320,1132,601,234,120,90,20]
}
]
};
myChart.setOption(option);
}
);
</script>完成以上操作之后效果图如下:
以上是echart插件等基本使用介绍的详细内容。更多信息请关注PHP中文网其他相关文章!

热AI工具

Undresser.AI Undress
人工智能驱动的应用程序,用于创建逼真的裸体照片

AI Clothes Remover
用于从照片中去除衣服的在线人工智能工具。

Undress AI Tool
免费脱衣服图片

Clothoff.io
AI脱衣机

AI Hentai Generator
免费生成ai无尽的。

热门文章
热工具

记事本++7.3.1
好用且免费的代码编辑器

SublimeText3汉化版
中文版,非常好用

禅工作室 13.0.1
功能强大的PHP集成开发环境

Dreamweaver CS6
视觉化网页开发工具

SublimeText3 Mac版
神级代码编辑软件(SublimeText3)


 如何使用mdf和mds文件
Feb 19, 2024 pm 05:36 PM
如何使用mdf和mds文件
Feb 19, 2024 pm 05:36 PM
mdf文件和mds文件怎么用随着计算机技术的不断进步,我们可以通过多种方式来存储和共享数据。在数字媒体领域,我们经常会遇到一些特殊的文件格式。在这篇文章中,我们将讨论一种常见的文件格式——mdf和mds文件,并介绍它们的使用方法。首先,我们需要了解mdf文件和mds文件的含义。mdf是CD/DVD镜像文件的扩展名,而mds文件则是mdf文件的元数据文件。
 crystaldiskmark是什么软件?-crystaldiskmark如何使用?
Mar 18, 2024 pm 02:58 PM
crystaldiskmark是什么软件?-crystaldiskmark如何使用?
Mar 18, 2024 pm 02:58 PM
CrystalDiskMark是一款适用于硬盘的小型HDD基准测试工具,可以快速测量顺序和随机读/写速度。接下来就让小编为大家介绍一下CrystalDiskMark,以及crystaldiskmark如何使用吧~一、CrystalDiskMark介绍CrystalDiskMark是一款广泛使用的磁盘性能测试工具,用于评估机械硬盘和固态硬盘(SSD)的读写速度和随机I/O性能。它是一款免费的Windows应用程序,并提供用户友好的界面和各种测试模式来评估硬盘驱动器性能的不同方面,并被广泛用于硬件评
 foobar2000怎么下载?-foobar2000怎么使用
Mar 18, 2024 am 10:58 AM
foobar2000怎么下载?-foobar2000怎么使用
Mar 18, 2024 am 10:58 AM
foobar2000是一款能随时收听音乐资源的软件,各种音乐无损音质带给你,增强版本的音乐播放器,让你得到更全更舒适的音乐体验,它的设计理念是将电脑端的高级音频播放器移植到手机上,提供更加便捷高效的音乐播放体验,界面设计简洁明了易于使用它采用了极简的设计风格,没有过多的装饰和繁琐的操作能够快速上手,同时还支持多种皮肤和主题,根据自己的喜好进行个性化设置,打造专属的音乐播放器支持多种音频格式的播放,它还支持音频增益功能根据自己的听力情况调整音量大小,避免过大的音量对听力造成损害。接下来就让小编为大
 百度网盘app怎么用
Mar 27, 2024 pm 06:46 PM
百度网盘app怎么用
Mar 27, 2024 pm 06:46 PM
在如今云存储已经成为我们日常生活和工作中不可或缺的一部分。百度网盘作为国内领先的云存储服务之一,凭借其强大的存储功能、高效的传输速度以及便捷的操作体验,赢得了广大用户的青睐。而且无论你是想要备份重要文件、分享资料,还是在线观看视频、听取音乐,百度网盘都能满足你的需求。但是很多用户们可能对百度网盘app的具体使用方法还不了解,那么这篇教程就将为大家详细介绍百度网盘app如何使用,还有疑惑的用户们就快来跟着本文详细了解一下吧!百度云网盘怎么用:一、安装首先,下载并安装百度云软件时,请选择自定义安装选
 网易邮箱大师怎么用
Mar 27, 2024 pm 05:32 PM
网易邮箱大师怎么用
Mar 27, 2024 pm 05:32 PM
网易邮箱,作为中国网民广泛使用的一种电子邮箱,一直以来以其稳定、高效的服务赢得了用户的信赖。而网易邮箱大师,则是专为手机用户打造的邮箱软件,它极大地简化了邮件的收发流程,让我们的邮件处理变得更加便捷。那么网易邮箱大师该如何使用,具体又有哪些功能呢,下文中本站小编将为大家带来详细的内容介绍,希望能帮助到大家!首先,您可以在手机应用商店搜索并下载网易邮箱大师应用。在应用宝或百度手机助手中搜索“网易邮箱大师”,然后按照提示进行安装即可。下载安装完成后,我们打开网易邮箱账号并进行登录,登录界面如下图所示
 小爱音箱怎么使用 小爱音箱怎么连接手机
Feb 22, 2024 pm 05:19 PM
小爱音箱怎么使用 小爱音箱怎么连接手机
Feb 22, 2024 pm 05:19 PM
长按音箱的播放键后,在软件中连接wifi即可使用。教程适用型号:小米12系统:EMUI11.0版本:小爱同学2.4.21解析1首先找到音箱的播放键,长按进入配网模式。2在手机上的小爱音箱软件中登录小米账号,点击添加新的小爱音箱。3输入wifi的名称和密码后,即可呼唤小爱同学进行使用了。补充:小爱音箱有什么功能1小爱音箱有系统功能、社交功能、娱乐功能、知识功能、生活功能、智能家庭、训练计划。总结/注意事项手机要提前安装好小爱同学APP,方便连接和使用。
 BTCC教学:如何在BTCC交易所绑定使用MetaMask钱包?
Apr 26, 2024 am 09:40 AM
BTCC教学:如何在BTCC交易所绑定使用MetaMask钱包?
Apr 26, 2024 am 09:40 AM
MetaMask(中文也叫小狐狸钱包)是一款免费的、广受好评的加密钱包软件。目前,BTCC已支持绑定MetaMask钱包,绑定后可使用MetaMask钱包进行快速登入,储值、买币等,且首次绑定还可获得20USDT体验金。在BTCCMetaMask钱包教学中,我们将详细介绍如何注册和使用MetaMask,以及如何在BTCC绑定并使用小狐狸钱包。MetaMask钱包是什么?MetaMask小狐狸钱包拥有超过3,000万用户,是当今最受欢迎的加密货币钱包之一。它可免费使用,可作为扩充功能安装在网络
 如何使用迅雷下载磁力链接
Feb 25, 2024 pm 12:51 PM
如何使用迅雷下载磁力链接
Feb 25, 2024 pm 12:51 PM
随着网络技术的迅猛发展,我们的生活也得到了极大的便利,其中之一就是能够通过网络下载和分享各种资源。而在下载资源的过程中,磁力链接成为了一种非常常见和方便的下载方式。那么,迅雷磁力链接又是如何使用的呢?下面,我将给大家详细介绍一下。迅雷是一款非常流行的下载工具,它支持多种下载方式,其中包括磁力链接。磁力链接可以理解为一种下载地址,通过它我们可以获取到资源的相关
