

通过在Vue中使用vue2-highcharts实现top功能(详细教程)
下面我就为大家分享一篇Vue 中使用vue2-highcharts实现top功能的示例,具有很好的参考价值,希望对大家有所帮助。
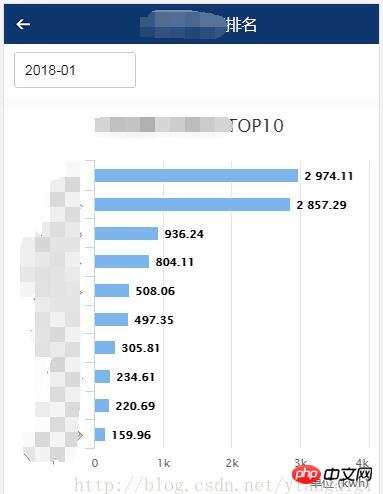
1、要实现的效果如下图:
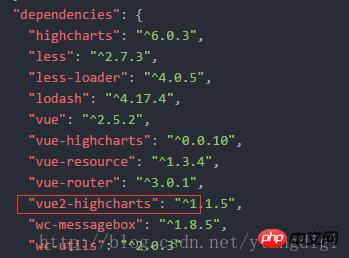
2、首先项目中引用vue2-highcharts
package.json中如下:
在命令行中输入:
cnpm install vue2-highcharts
3、页面代码如下:
<template>
<p >
<p>
<p id="transparent-header" class="rank-head container" >
<img src="../assets/index/back.png" class="rank-head-back" @click="routerBack"/>
<span >用能排名</span>
</p>
</p>
<p >
<p >
<datepicker v-on:picked="picked" style="margin-left:10px;"></datepicker>
</p>
<p >
</p>
</p>
<p >
<p class="charts">
<vue-highcharts :options="options" ref="maxLineCharts"></vue-highcharts>
</p>
</p>
<p >
<p class="charts">
<vue-highcharts :options="options" ref="minLineCharts"></vue-highcharts>
</p>
</p>
</p>
</template>
<script>
import datepicker from '../components/datepicker.vue'
import VueHighcharts from 'vue2-highcharts'
export default {
data() {
return{
topHeight:240,
freezeMon:'',
ownerFreeData: [],
options:{
credits: {
enabled: false
},
legend: {
enabled: false
},
global: {
useUTC: false
},
chart: {
type: 'bar'
},
title: {
text: ' '
},
subtitle: {
text: ''
},
xAxis:[{
categories: ['1', '2', '3', '4', '5','6', '7', '8', '9', '10'],
title: {
text: null
},
labels: {
rotation: -45
}
}],
yAxis:[{
min: 0,
labels:{
overflow: 'justify'
},
title: {
text: '单位 (kwh)',
align: 'high'
}
}],
tooltip: {
formatter: function(){
return this.x+':'+this.y+'kwh';
}
},
credits: {
enabled: false
},
plotOptions: {
bar: {
dataLabels: {
enabled: true
}
},
series: [{
type: 'bar'
}]
}
}
}
},
methods: {
picked(year, month, date) {
if(month < 10){
this.freezeMon = `${year}-0${month}`;
}else{
this.freezeMon = `${year}-${month}`;
}
this.getList();
},
routerBack(){
this.$router.go(-1);
},
getList(){
let maxLineCharts = this.$refs.maxLineCharts;
let minLineCharts = this.$refs.minLineCharts;
if(maxLineCharts != null && minLineCharts != null){
//移除所有Series
maxLineCharts.removeSeries();
minLineCharts.removeSeries();
//设置标题名
maxLineCharts.getChart().title.update({ text: '用能最大TOP10' });
minLineCharts.getChart().title.update({ text: '用能最小TOP10' });
var userType = sessionStorage.getItem('userType');
var areaCode = sessionStorage.getItem('areaCode');
this.$http.post(this.URLINFO + '/mobile/rankingMonitor/getDayFreezeApp.do',{yearMonth:this.freezeMon,userType:userType,areaCode:areaCode})
.then(function (res) {
var seriesData = []
var categoriesData = []
for(var i = 0;i < res.data.max.length; i++) {
//maxLineCharts.addSeries({name:res.data.max[i][1],data: [{name: res.data.max[i][1],y:res.data.max[i][2]}]});
seriesData.push([res.data.max[i][1],res.data.max[i][2]]);
categoriesData.push(res.data.max[i][1]);
}
maxLineCharts.addSeries({name: '用能',data: seriesData});
maxLineCharts.getChart().xAxis[0].setCategories(categoriesData);
seriesData = []
categoriesData = []
for(var i = 0;i < res.data.min.length; i++) {
//minLineCharts.addSeries({name:res.data.min[i][1],data: [{name: res.data.min[i][1],y:res.data.min[i][2]}]});
seriesData.push([res.data.min[i][1],res.data.min[i][2]]);
categoriesData.push(res.data.min[i][1]);
}
minLineCharts.addSeries({name: '用能',data: seriesData});
minLineCharts.getChart().xAxis[0].setCategories(categoriesData);
})
.catch(function (error) {
this.$toast('查询排名信息异常');
});
}
}
},
components: {
datepicker,
VueHighcharts
},
mounted () {
this.getList()
}
}
</script>
<style>
*{margin:0;padding:0; list-style:none }
h1,h2,h3,h4,h5,h6{font-size:16px; font-weight:normal;}
.rank-head{
width: 100%;
height: 40px;
position:fixed;
background: -webkit-linear-gradient(top,rgba(0,0,0,.6),rgba(0,0,0,0));
z-index: 999;
color: #fff;
font-size: 16px;
text-align: center;
line-height: 40px;
}
.container{
width: 100%;
overflow: hidden
}
.rank-head-back{
display: block;
float: left;
width: 40px;
height: 40px;
background: url("../assets/index/back.png") no-repeat center center;
background-size: 100% 100%;
}
</style>上面是我整理给大家的,希望今后会对大家有帮助。
相关文章:
以上是通过在Vue中使用vue2-highcharts实现top功能(详细教程)的详细内容。更多信息请关注PHP中文网其他相关文章!

热AI工具

Undresser.AI Undress
人工智能驱动的应用程序,用于创建逼真的裸体照片

AI Clothes Remover
用于从照片中去除衣服的在线人工智能工具。

Undress AI Tool
免费脱衣服图片

Clothoff.io
AI脱衣机

AI Hentai Generator
免费生成ai无尽的。

热门文章
热工具

记事本++7.3.1
好用且免费的代码编辑器

SublimeText3汉化版
中文版,非常好用

禅工作室 13.0.1
功能强大的PHP集成开发环境

Dreamweaver CS6
视觉化网页开发工具

SublimeText3 Mac版
神级代码编辑软件(SublimeText3)
热门话题


 vivox100s和x100区别:性能对比及功能解析
Mar 23, 2024 pm 10:27 PM
vivox100s和x100区别:性能对比及功能解析
Mar 23, 2024 pm 10:27 PM
vivox100s和x100手机都是vivo手机产品线中的代表机型,它们分别代表了vivo在不同时间段内的高端技术水平,因此这两款手机在设计、性能和功能上均有一定区别。本文将从性能对比和功能解析两个方面对这两款手机进行详细比较,帮助消费者更好地选择适合自己的手机。首先,我们来看vivox100s和x100在性能方面的对比。vivox100s搭载了最新的
 华为手机如何实现双微信登录?
Mar 24, 2024 am 11:27 AM
华为手机如何实现双微信登录?
Mar 24, 2024 am 11:27 AM
华为手机如何实现双微信登录?随着社交媒体的兴起,微信已经成为人们日常生活中不可或缺的沟通工具之一。然而,许多人可能会遇到一个问题:在同一部手机上同时登录多个微信账号。对于华为手机用户来说,实现双微信登录并不困难,本文将介绍华为手机如何实现双微信登录的方法。首先,华为手机自带的EMUI系统提供了一个很便利的功能——应用双开。通过应用双开功能,用户可以在手机上同
 自媒体到底是什么?它的主要特点和功能有哪些?
Mar 21, 2024 pm 08:21 PM
自媒体到底是什么?它的主要特点和功能有哪些?
Mar 21, 2024 pm 08:21 PM
随着互联网的快速发展,自媒体这个概念已经深入人心。那么,自媒体到底是什么?它有哪些主要特点和功能呢?接下来,我们将一一探讨这些问题。一、自媒体到底是什么?自媒体,顾名思义,就是自己就是媒体。它是指通过互联网平台,个人或者团队可以自主创建、编辑、发布和传播内容的信息载体。不同于传统媒体,如报纸、电视、电台等,自媒体具有更强的互动性和个性化,让每个人都能成为信息的生产者和传播者。二、自媒体的主要特点和功能有哪些?1.低门槛:自媒体的崛起降低了进入媒体行业的门槛,不再需要繁琐的设备和专业的团队,一部手
 PHP编程指南:实现斐波那契数列的方法
Mar 20, 2024 pm 04:54 PM
PHP编程指南:实现斐波那契数列的方法
Mar 20, 2024 pm 04:54 PM
编程语言PHP是一种用于Web开发的强大工具,能够支持多种不同的编程逻辑和算法。其中,实现斐波那契数列是一个常见且经典的编程问题。在这篇文章中,将介绍如何使用PHP编程语言来实现斐波那契数列的方法,并附上具体的代码示例。斐波那契数列是一个数学上的序列,其定义如下:数列的第一个和第二个元素为1,从第三个元素开始,每个元素的值等于前两个元素的和。数列的前几个元
 小红书账号管理软件有哪些功能?怎么经营小红书账号?
Mar 21, 2024 pm 04:16 PM
小红书账号管理软件有哪些功能?怎么经营小红书账号?
Mar 21, 2024 pm 04:16 PM
随着小红书在年轻人中的流行,越来越多的人开始利用这一平台分享各方面的经验和生活见解。如何有效管理多个小红书账号成为一个关键问题。在本文中,我们将讨论一些小红书账号管理软件的功能,并探讨如何更好地经营小红书账号。随着社交媒体的发展,许多人发现自己需要管理多个社交账号。对于小红书用户来说,这也是一个挑战。一些小红书账号管理软件可以帮助用户更轻松地管理多个账号,包括自动发布内容、定时发布、数据分析等功能。通过这些工具,用户可以更高效地管理他们的账号,提高账号的曝光率和关注度。另一、小红书账号管理软件有
 如何在华为手机上实现微信分身功能
Mar 24, 2024 pm 06:03 PM
如何在华为手机上实现微信分身功能
Mar 24, 2024 pm 06:03 PM
如何在华为手机上实现微信分身功能随着社交软件的普及和人们对隐私安全的日益重视,微信分身功能逐渐成为人们关注的焦点。微信分身功能可以帮助用户在同一台手机上同时登录多个微信账号,方便管理和使用。在华为手机上实现微信分身功能并不困难,只需要按照以下步骤操作即可。第一步:确保手机系统版本和微信版本符合要求首先,确保你的华为手机系统版本已更新到最新版本,以及微信App
 PHP技巧:快速实现返回上一页功能
Mar 09, 2024 am 08:21 AM
PHP技巧:快速实现返回上一页功能
Mar 09, 2024 am 08:21 AM
PHP技巧:快速实现返回上一页功能在网页开发中,经常会遇到需要实现返回上一页的功能。这样的操作可以提高用户体验,让用户更加方便地在网页之间进行导航。在PHP中,我们可以通过一些简单的代码来实现这一功能。本文将介绍如何快速实现返回上一页功能,并提供具体的PHP代码示例。在PHP中,我们可以使用$_SERVER['HTTP_REFERER']来获取上一页的URL
 掌握Golang如何实现游戏开发的可能性
Mar 16, 2024 pm 12:57 PM
掌握Golang如何实现游戏开发的可能性
Mar 16, 2024 pm 12:57 PM
在当今的软件开发领域中,Golang(Go语言)作为一种高效、简洁、并发性强的编程语言,越来越受到开发者的青睐。其丰富的标准库和高效的并发特性使它成为游戏开发领域的一个备受关注的选择。本文将探讨如何利用Golang来实现游戏开发,并通过具体的代码示例来展示其强大的可能性。1.Golang在游戏开发中的优势作为一种静态类型语言,Golang在构建大型游戏系统
