详解微信小程序中如何安装和引用ECharts?
本篇文章给大家介绍一下微信小程序中使用 npm 引入 ECharts 的方法,希望对大家有所帮助!

Apache ECharts 官方提供了在微信小程序中使用Echarts 的代码实例和 ec-canvas 组件,但是未发布 npm 包。
此项目在官方代码之上修改支持 ec-canvas 组件传入 echarts 可支持 npm 引入 echarts 或本地自定义构建后的 echarts,更符合 Web 开发体验。
并且发布 npm 包,支持小程序通过 npm 安装使用。并支持 Taro 按需引入 echarts 减小打包体积。【相关学习推荐:小程序开发教程】
安装
npm install echarts-for-weixin
小程序引用
参考代码 tools/demo
1、首先在页面的 json 文件加入 usingComponents 配置字段
{
  "usingComponents": {
    "ec-canvas": "echarts-for-weixin"
  }
}2、项目根目录创建 package.json 并执行 npm install 安装依赖
{
  "dependencies": {
    "echarts": "^5.1.2",
    "echarts-for-weixin": "^1.0.0"
  }
}3、小程序开发者工具中构建 npm
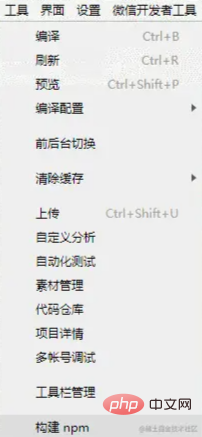
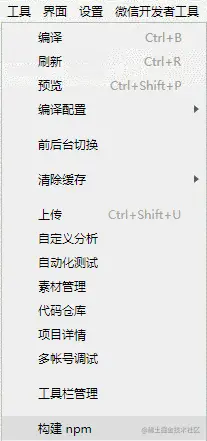
点击开发者工具中的菜单栏:工具 --> 构建 npm

4、在页面中引入 echarts,可以从 npm 引入 echarts,也可以引入本地自定义构建的 echarts 以减小体积
import * as echarts from 'echarts' // 从 npm 引入 echarts
import * as echarts from './echarts' // 或者从本地引入自定义构建的 echarts
5、然后可以在对应页面的 wxml 中直接使用该组件
<view class="container">
  <ec-canvas id="mychart-dom-bar" canvas-id="mychart-bar" echarts="{{ echarts }}" ec="{{ ec }}"></ec-canvas>
</view>6、ec-canvas 的具体用法和如何初始化图表请参考 Echarts 官方小程序示例
import * as echarts from 'echarts'

let chart = null;

function initChart(canvas, width, height, dpr) {
  chart = echarts.init(canvas, null, {
    width: width,
    height: height,
    devicePixelRatio: dpr // new
  });
  canvas.setChart(chart);

  var option = {
    tooltip: {
      trigger: 'axis',
      axisPointer: {            // 坐标轴指示器,坐标轴触发有效
        type: 'shadow'        // 默认为直线,可选为:'line' | 'shadow'
      },
      confine: true
    },
    legend: {
      data: ['热度', '正面', '负面']
    },
    grid: {
      left: 20,
      right: 20,
      bottom: 15,
      top: 40,
      containLabel: true
    },
    xAxis: [
      {
        type: 'value',
        axisLine: {
          lineStyle: {
            color: '#999'
          }
        },
        axisLabel: {
          color: '#666'
        }
      }
    ],
    yAxis: [
      {
        type: 'category',
        axisTick: { show: false },
        data: ['汽车之家', '今日头条', '百度贴吧', '一点资讯', '微信', '微博', '知乎'],
        axisLine: {
          lineStyle: {
            color: '#999'
          }
        },
        axisLabel: {
          color: '#666'
        }
      }
    ],
    series: [
      {
        name: '热度',
        type: 'bar',
        label: {
          normal: {
            show: true,
            position: 'inside'
          }
        },
        data: [300, 270, 340, 344, 300, 320, 310],
        itemStyle: {
          // emphasis: {
          //   color: '#37a2da'
          // }
        }
      },
      {
        name: '正面',
        type: 'bar',
        stack: '总量',
        label: {
          normal: {
            show: true
          }
        },
        data: [120, 102, 141, 174, 190, 250, 220],
        itemStyle: {
          // emphasis: {
          //   color: '#32c5e9'
          // }
        }
      },
      {
        name: '负面',
        type: 'bar',
        stack: '总量',
        label: {
          normal: {
            show: true,
            position: 'left'
          }
        },
        data: [-20, -32, -21, -34, -90, -130, -110],
        itemStyle: {
          // emphasis: {
          //   color: '#67e0e3'
          // }
        }
      }
    ]
  };

  chart.setOption(option);
  return chart;
}

Page({
  data: {
    echarts,
    ec: {
      onInit: initChart
    }
  },
  onReady() {
    setTimeout(function () {
      // 获取 chart 实例的方式
      console.log(chart)
    }, 2000);
  }
})Taro 引用
参考代码 examples/taro
准备工作
- 安装依赖
npm install echarts-for-weixin
- 在项目根目录中新建文件
project.package.json或者自定义命名,此文件是小程序的package.json,并在下一步中添加小程序自定义构建 npm 方式。这么做的目的是为了能够共享项目node_modules
project.package.json
{
  "dependencies": {
    "echarts": "^5.1.2",
    "echarts-for-weixin": "^1.0.2"
  }
}- 在
project.config的setting中添加小程序自定义构建 npm 方式,参考 自定义 node_modules 和 miniprogram_npm 位置的构建 npm 方式
{
  "setting": {
    "packNpmManually": true,
    "packNpmRelationList": [
      {
        "packageJsonPath": "../project.package.json",
        "miniprogramNpmDistDir": "./"
      }
    ]
  }
}- 执行
Taro的开发或者打包命令进行项目开发
npm run dev:weapp
- 小程序开发者工具中构建 npm。注意:小程序开发工具打开的项目目录是
dist文件夹
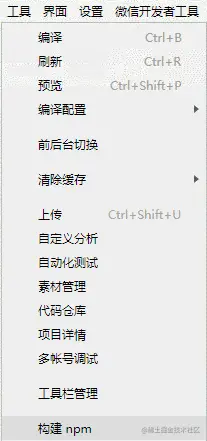
点击开发者工具中的菜单栏:工具 --> 构建 npm

引入 Echarts
- 在全局的
app.config.js中添加或者在单个需要使用到echarts的页面配置中添加引用组件
{
  "usingComponents": {
    "ec-canvas": "echarts-for-weixin"
  }
}- 在页面中引入
echarts,可以从npm引入echarts,也可以引入本地自定义构建的echarts以减小体积
import * as echarts from 'echarts' // 从 npm 引入 echarts
import * as echarts from './echarts' // 或者从本地引入自定义构建的 echarts
- 将引入的
echarts传给组件
<ec-canvas
id='mychart-dom-area'
canvas-id='mychart-area'
echarts={echarts} // 将引入的 echarts 传给组件
ec={this.state.ec}
/>ec-canvas的具体用法和如何初始化图表请参考 Echarts 官方小程序示例
示例代码
function initChart(canvas, width, height) { const chart = echarts.init(canvas, null, { width: width, height: height
})
canvas.setChart(chart) const model = { yCates: ['Saturday', 'Friday', 'Thursday', 'Wednesday', 'Tuesday', 'Monday', 'Sunday'], xCates: ['1', '2', '3', '4', '5'], data: [ // [yCateIndex, xCateIndex, value]
[0, 0, 5], [0, 1, 7], [0, 2, 3], [0, 3, 5], [0, 4, 2],
[1, 0, 1], [1, 1, 2], [1, 2, 4], [1, 3, 8], [1, 4, 2],
[2, 0, 2], [2, 1, 3], [2, 2, 8], [2, 3, 6], [2, 4, 7],
[3, 0, 3], [3, 1, 7], [3, 2, 5], [3, 3, 1], [3, 4, 6],
[4, 0, 3], [4, 1, 2], [4, 2, 7], [4, 3, 8], [4, 4, 9],
[5, 0, 2], [5, 1, 2], [5, 2, 3], [5, 3, 4], [5, 4, 7],
[6, 0, 6], [6, 1, 5], [6, 2, 3], [6, 3, 1], [6, 4, 2]
]
} const data = model.data.map(function (item) { return [item[1], item[0], item[2] || '-']
}) const option = { tooltip: { position: 'top'
}, animation: false, grid: { bottom: 60, top: 10, left: 80
}, xAxis: { type: 'category', data: model.xCates
}, yAxis: { type: 'category', data: model.yCates
}, visualMap: { min: 1, max: 10, show: false, calculable: true, orient: 'horizontal', left: 'center', bottom: 10, inRange: { color: ['#37A2DA', '#32C5E9', '#67E0E3', '#91F2DE', '#FFDB5C', '#FF9F7F'],
}
}, series: [{ name: 'Punch Card', type: 'heatmap', data: data, label: { normal: { show: true
}
}, itemStyle: { emphasis: { shadowBlur: 10, shadowColor: 'rgba(0, 0, 0, 0.5)'
}
}
}]
}
chart.setOption(option) return chart
}export default class Echarts extends React.Component {
state = { ec: { onInit: initChart
}
}
render () { return ( <View className='echarts'> <ec-canvas
id='mychart-dom-area'
canvas-id='mychart-area'
echarts={echarts}
ec={this.state.ec}
/> </View>
)
}
}复制代码Taro 按需引用
参考代码 examples/taro-manual-load
注意:小程序开发者工具打开的项目目录是打包后的 dist 目录
准备工作
1、安装依赖
npm install echarts-for-weixin
2、在项目根目录中新建文件 project.package.json 或者自定义命名,此文件是小程序的 package.json,并在下一步中添加小程序自定义构建 npm 方式。并配置 config/index.js 中的 copy 选项,将 project.package.json 复制到 dist 目录下并且重命名为 package.json。并且复制 node_modules/echarts-for-weixin 至 dist/node_modules/echarts-for-weixin 避免在小程序开发者工具中打开的项目重新安装依赖
project.package.json
{
  "dependencies": {
    "echarts-for-weixin": "^1.0.2"
  }
}config/index.js
{
  copy: {
    patterns: [
      { from: 'project.package.json', to: 'dist/package.json' }, // 指定需要 copy 的文件
      { from: 'node_modules/echarts-for-weixin/', to: 'dist/node_modules/echarts-for-weixin/' }
    ],
    options: {}
  }
}3、在 project.config 的 setting 中添加小程序自定义构建 npm 方式,参考 自定义 node_modules 和 miniprogram_npm 位置的构建 npm 方式
{
  "setting": {
    "packNpmManually": true,
    "packNpmRelationList": [
      {
        "packageJsonPath": "./package.json",
        "miniprogramNpmDistDir": "./"
      }
    ]
  }
}4、执行 Taro 的开发或者打包命令进行项目开发
npm run dev:weapp
5、小程序开发者工具中构建 npm。注意:小程序开发工具打开的项目目录是 dist 文件夹
点击开发者工具中的菜单栏:工具 --> 构建 npm

引入 Echarts
1、在全局的 app.config.js 中添加或者在单个需要使用到 echarts 的页面配置中添加引用组件
{
  "usingComponents": {
    "ec-canvas": "echarts-for-weixin"
  }
}2、在页面中引入 echarts/core 和需要的组件,Taro 打包会只打包引入的组件,这样达到按需引入的目的
// Import the echarts core module, which provides the necessary interfaces for using echarts.
import * as echarts from 'echarts/core';
// Import charts, all with Chart suffix
import {
  // LineChart,
  BarChart,
  // PieChart,
  // ScatterChart,
  // RadarChart,
  // MapChart,
  // TreeChart,
  // TreemapChart,
  // GraphChart,
  // GaugeChart,
  // FunnelChart,
  // ParallelChart,
  // SankeyChart,
  // BoxplotChart,
  // CandlestickChart,
  // EffectScatterChart,
  // LinesChart,
  // HeatmapChart,
  // PictorialBarChart,
  // ThemeRiverChart,
  // SunburstChart,
  // CustomChart,
} from 'echarts/charts';
// import components, all suffixed with Component
import {
  // GridSimpleComponent,
  GridComponent,
  // PolarComponent,
  // RadarComponent,
  // GeoComponent,
  // SingleAxisComponent,
  // ParallelComponent,
  // CalendarComponent,
  // GraphicComponent,
  // ToolboxComponent,
  TooltipComponent,
  // AxisPointerComponent,
  // BrushComponent,
  TitleComponent,
  // TimelineComponent,
  // MarkPointComponent,
  // MarkLineComponent,
  // MarkAreaComponent,
  // LegendComponent,
  // LegendScrollComponent,
  // LegendPlainComponent,
  // DataZoomComponent,
  // DataZoomInsideComponent,
  // DataZoomSliderComponent,
  // VisualMapComponent,
  // VisualMapContinuousComponent,
  // VisualMapPiecewiseComponent,
  // AriaComponent,
  // TransformComponent,
  DatasetComponent,
} from 'echarts/components';
// Import renderer, note that introducing the CanvasRenderer or SVGRenderer is a required step
import {
  CanvasRenderer,
  // SVGRenderer,
} from 'echarts/renderers';
// Register the required components
echarts.use(
  [
    TitleComponent,
    TooltipComponent,
    GridComponent,
    BarChart,
    CanvasRenderer,
    HeatmapChart,
    VisualMapComponent,
    VisualMapContinuousComponent,
    VisualMapPiecewiseComponent,
  ]
);3、将引入的 echarts 传给组件
<ec-canvas
id='mychart-dom-area'
canvas-id='mychart-area'
echarts={echarts} // 将引入的 echarts 传给组件
ec={this.state.ec}
/>4、ec-canvas 的具体用法和如何初始化图表请参考 Echarts 官方小程序示例
function initChart(canvas, width, height) {
const chart = echarts.init(canvas, null, {
width: width,
height: height
})
canvas.setChart(chart)
const model = {
yCates: ['Saturday', 'Friday', 'Thursday',
'Wednesday', 'Tuesday', 'Monday',
'Sunday'],
xCates: ['1', '2', '3', '4', '5'],
data: [
// [yCateIndex, xCateIndex, value]
[0, 0, 5], [0, 1, 7], [0, 2, 3], [0, 3, 5], [0, 4, 2],
[1, 0, 1], [1, 1, 2], [1, 2, 4], [1, 3, 8], [1, 4, 2],
[2, 0, 2], [2, 1, 3], [2, 2, 8], [2, 3, 6], [2, 4, 7],
[3, 0, 3], [3, 1, 7], [3, 2, 5], [3, 3, 1], [3, 4, 6],
[4, 0, 3], [4, 1, 2], [4, 2, 7], [4, 3, 8], [4, 4, 9],
[5, 0, 2], [5, 1, 2], [5, 2, 3], [5, 3, 4], [5, 4, 7],
[6, 0, 6], [6, 1, 5], [6, 2, 3], [6, 3, 1], [6, 4, 2]
]
}
const data = model.data.map(function (item) {
return [item[1], item[0], item[2] || '-']
})
const option = {
tooltip: {
position: 'top'
},
animation: false,
grid: {
bottom: 60,
top: 10,
left: 80
},
xAxis: {
type: 'category',
data: model.xCates
},
yAxis: {
type: 'category',
data: model.yCates
},
visualMap: {
min: 1,
max: 10,
show: false,
calculable: true,
orient: 'horizontal',
left: 'center',
bottom: 10,
inRange: {
color: ['#37A2DA', '#32C5E9', '#67E0E3', '#91F2DE', '#FFDB5C', '#FF9F7F'],
}
},
series: [{
name: 'Punch Card',
type: 'heatmap',
data: data,
label: {
normal: {
show: true
}
},
itemStyle: {
emphasis: {
shadowBlur: 10,
shadowColor: 'rgba(0, 0, 0, 0.5)'
}
}
}]
}
chart.setOption(option)
return chart
}
export default class Echarts extends React.Component {
state = {
ec: {
onInit: initChart
}
}
render () {
return (
<View className='echarts'>
<ec-canvas
id='mychart-dom-area'
canvas-id='mychart-area'
echarts={echarts}
ec={this.state.ec}
/>
</View>
)
}
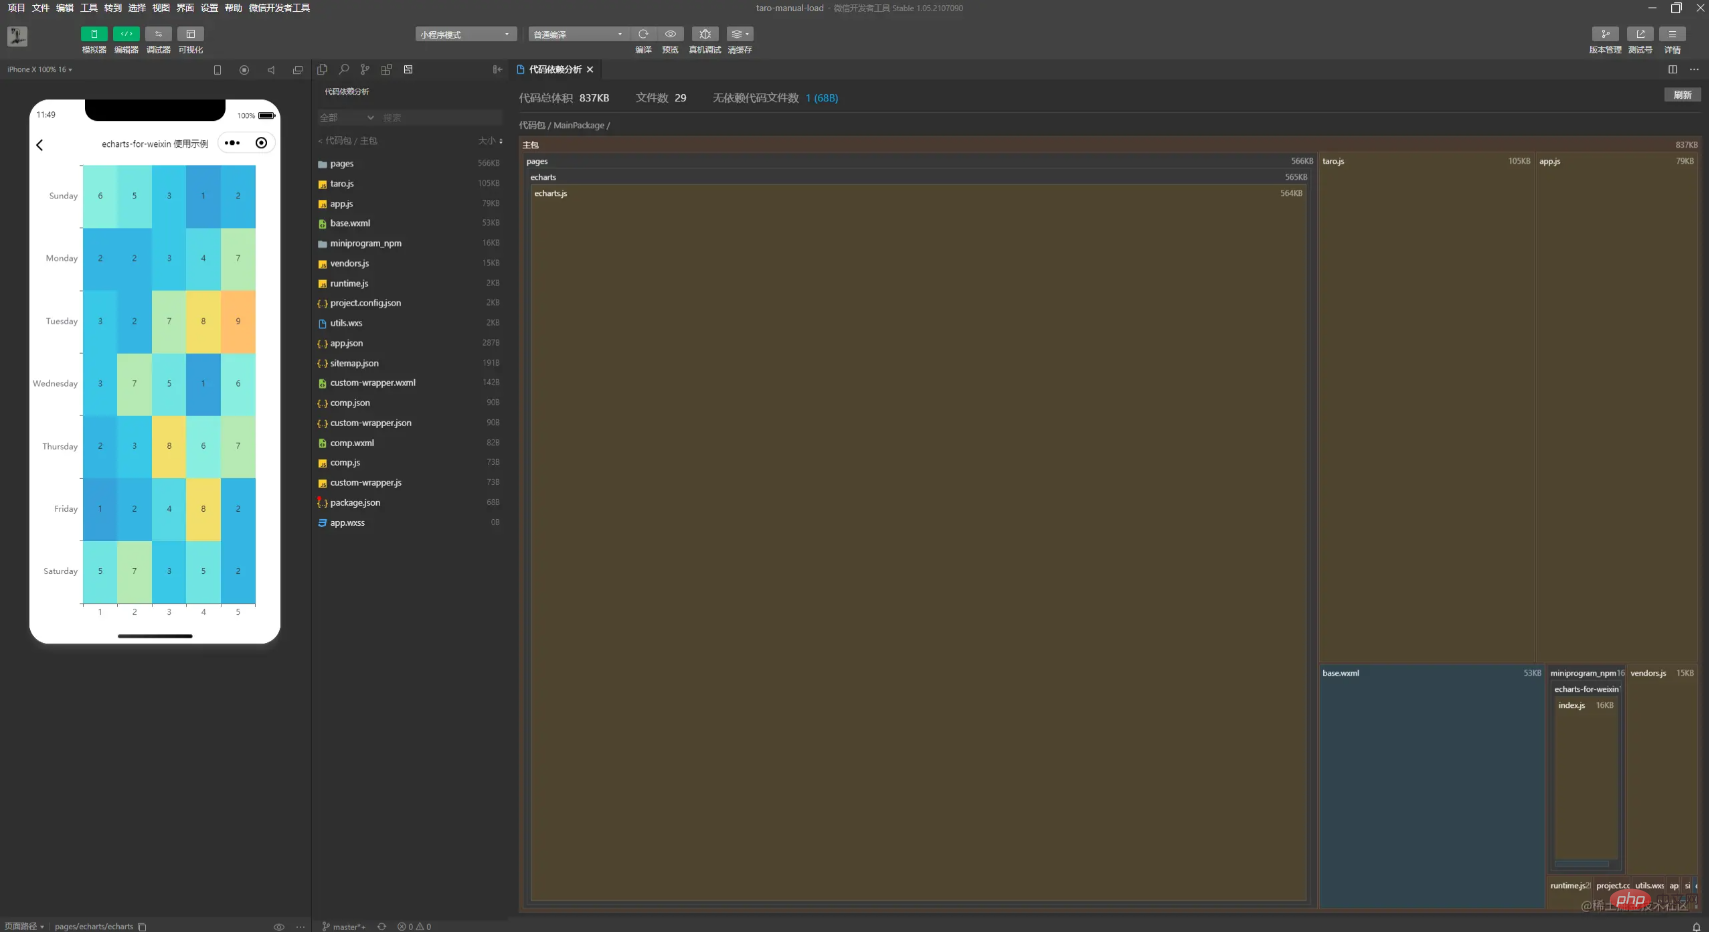
}5、可以查看小程序开发者工具中的依赖分析,确定文件大小以及是否正确按需引入

更多编程相关知识,请访问:编程入门!!
以上是详解微信小程序中如何安装和引用ECharts?的详细内容。更多信息请关注PHP中文网其他相关文章!

热AI工具

Undresser.AI Undress
人工智能驱动的应用程序,用于创建逼真的裸体照片

AI Clothes Remover
用于从照片中去除衣服的在线人工智能工具。

Undress AI Tool
免费脱衣服图片

Clothoff.io
AI脱衣机

Video Face Swap
使用我们完全免费的人工智能换脸工具轻松在任何视频中换脸!

热门文章

热工具

记事本++7.3.1
好用且免费的代码编辑器

SublimeText3汉化版
中文版,非常好用

禅工作室 13.0.1
功能强大的PHP集成开发环境

Dreamweaver CS6
视觉化网页开发工具

SublimeText3 Mac版
神级代码编辑软件(SublimeText3)
 ECharts和Java接口:如何快速实现折线图、柱状图、饼图等统计图
Dec 17, 2023 pm 10:37 PM
ECharts和Java接口:如何快速实现折线图、柱状图、饼图等统计图,需要具体代码示例随着互联网时代的到来,数据分析变得越来越重要。统计图表是一种非常直观而又有力的展示方式,通过图表可以更加清晰地展示数据,让人们更好地理解数据的内涵和规律。在Java开发中,我们可以使用ECharts和Java接口来快速实现各种统计图表的展示。ECharts是一款由百度开发
 闲鱼微信小程序正式上线
Feb 10, 2024 pm 10:39 PM
闲鱼官方微信小程序悄然上线,在小程序中可以发布闲置与买家/卖家私信交流、查看个人资料及订单、搜索物品等,有用好奇闲鱼微信小程序叫什么,现在快来看一下。闲鱼微信小程序叫什么答案:闲鱼,闲置交易二手买卖估价回收。1、在小程序中可以发布闲置、与买家/卖家私信交流、查看个人资料及订单、搜索指定物品等功能;2、在小程序的页面中有首页、附近、发闲置、消息、我的5项功能;3、想要使用的话必要要开通微信支付才可以购买;
 如何利用php接口和ECharts生成可视化的统计图表
Dec 18, 2023 am 11:39 AM
在今天数据可视化变得越来越重要的背景下,许多开发者都希望能够利用各种工具,快速生成各种图表与报表,以便能够更好的展示数据,帮助决策者快速做出判断。而在此背景下,利用Php接口和ECharts库可以帮助许多开发者快速生成可视化的统计图表。本文将详细介绍如何利用Php接口和ECharts库生成可视化的统计图表。在具体实现时,我们将使用MySQL
 使用ECharts和Python接口绘制仪表盘的步骤
Dec 18, 2023 am 08:40 AM
使用ECharts和Python接口绘制仪表盘的步骤,需要具体代码示例摘要:ECharts是一款优秀的数据可视化工具,通过Python接口可以方便地进行数据处理和图形绘制。本文将介绍使用ECharts和Python接口绘制仪表盘的具体步骤,并提供示例代码。关键词:ECharts、Python接口、仪表盘、数据可视化简介仪表盘是一种常用的数据可视化形式,它通过
 闲鱼微信小程序叫什么
Feb 27, 2024 pm 01:11 PM
闲鱼官方微信小程序已经悄然上线,它为用户提供了一个便捷的平台,让你可以轻松地发布和交易闲置物品。在小程序中,你可以与买家或卖家进行私信交流,查看个人资料和订单,以及搜索你想要的物品。那么闲鱼在微信小程序中究竟叫什么呢,这篇教程攻略将为您详细介绍,想要了解的用户们快来跟着本文继续阅读吧!闲鱼微信小程序叫什么答案:闲鱼,闲置交易二手买卖估价回收。1、在小程序中可以发布闲置、与买家/卖家私信交流、查看个人资料及订单、搜索指定物品等功能;2、在小程序的页面中有首页、附近、发闲置、消息、我的5项功能;3、
 如何在ECharts中使用柱状图展示数据
Dec 18, 2023 pm 02:21 PM
如何在ECharts中使用柱状图展示数据ECharts是一款基于JavaScript的数据可视化库,在数据可视化的领域非常流行和使用广泛。其中,柱状图是最常见和常用的一种图表类型,可以用于展示各种数值数据的大小、比较和趋势分析。本文将介绍如何使用ECharts来绘制柱状图,并提供代码示例。首先,我们需要在HTML文件中引入ECharts库,可以通过以下方式引
 如何在ECharts中使用地图热力图展示城市热度
Dec 18, 2023 pm 04:00 PM
如何在ECharts中使用地图热力图展示城市热度ECharts是一款功能强大的可视化图表库,它提供了各种图表类型供开发人员使用,包括地图热力图。地图热力图可以用于展示城市或地区的热度,帮助我们快速了解不同地方的热门程度或密集程度。本文将介绍如何使用ECharts中的地图热力图来展示城市热度,并提供代码示例供参考。首先,我们需要一个包含地理信息的地图文件,EC
 ECharts和golang技术指南: 创建各类统计图表的实用秘籍
Dec 17, 2023 pm 09:56 PM
ECharts和golang技术指南:创建各类统计图表的实用秘籍,需要具体代码示例导语:在现代化的数据可视化领域,统计图表是数据分析和可视化的重要工具。ECharts是一个强大的数据可视化库,而golang是一种快速,可靠且高效的编程语言。本文将向您介绍如何使用ECharts和golang创建各种类型的统计图表,并提供代码示例,帮助您掌握这一技能。准备工作


