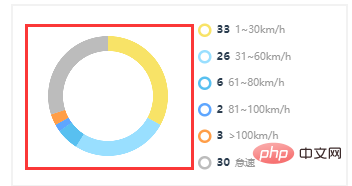
react项目怎么增加echarts饼图
react项目增加echarts饼图的方法:1、通过“npm install echarts --save”命令安装“echarts”;2、使用import引入“echarts/lib/echarts”;3、通过“componentDidMount() {...}”实现增加echarts饼图即可。

本教程操作环境:Windows10系统、react18.0.0版、Dell G3电脑。
react项目怎么增加echarts饼图?
一、安装
npm install echarts --save
二、引入
import echarts from 'echarts/lib/echarts';
import  'echarts/lib/chart/pie';  //饼状图
import  'echarts/lib/component/tooltip';
import  'echarts/lib/component/title';
import  'echarts/lib/component/legend'
import  'echarts/lib/component/markPoint'
三、使用
componentDidMount() {
        //环形图百分比
        var huan_val = document.getElementsByClassName("huan")[0];
        var chart = echarts.init(huan_val);
        let option = {
            color: ["#f8e367", "#99dfff", "#58c0f0", "#5ea6ff", "#ff9e48", "#bcbcbc"],
            series: [{
                name: "驾驶分析",
                type: "pie",
                radius: ['60%', '80%'],
                avoidLabelOverlap: false,
                label: {
                    normal: {
                        show: false,
                        position: 'center'
                    },
                    emphasis: {
                        show: true,
                        textStyle: {
                            fontSize: '30',
                            fontWeight: 'bold'
                        }
                    }
                },
                labelLine: {
                    normal: {
                        show: false
                    }
                },
                data: [{
                    value: 33,
                    name: '慢速'
                }, {
                    value: 26,
                    name: '低速'
                }, {
                    value: 6,
                    name: '中速'
                }, {
                    value: 2,
                    name: '高速'
                }, {
                    value: 3,
                    name: '超速'
                }, {
                    value: 30,
                    name: '怠速'
                }]
            }]
        };
        chart.setOption(option);
}render(){
return(
<div className="huan"></div>
)}四、结果
推荐学习:《react视频教程》
以上是react项目怎么增加echarts饼图的详细内容。更多信息请关注PHP中文网其他相关文章!

热AI工具

Undresser.AI Undress
人工智能驱动的应用程序,用于创建逼真的裸体照片

AI Clothes Remover
用于从照片中去除衣服的在线人工智能工具。

Undress AI Tool
免费脱衣服图片

Clothoff.io
AI脱衣机

AI Hentai Generator
免费生成ai无尽的。

热门文章

热工具

记事本++7.3.1
好用且免费的代码编辑器

SublimeText3汉化版
中文版,非常好用

禅工作室 13.0.1
功能强大的PHP集成开发环境

Dreamweaver CS6
视觉化网页开发工具

SublimeText3 Mac版
神级代码编辑软件(SublimeText3)

热门话题
 ECharts和Java接口:如何快速实现折线图、柱状图、饼图等统计图
Dec 17, 2023 pm 10:37 PM
ECharts和Java接口:如何快速实现折线图、柱状图、饼图等统计图,需要具体代码示例随着互联网时代的到来,数据分析变得越来越重要。统计图表是一种非常直观而又有力的展示方式,通过图表可以更加清晰地展示数据,让人们更好地理解数据的内涵和规律。在Java开发中,我们可以使用ECharts和Java接口来快速实现各种统计图表的展示。ECharts是一款由百度开发
 使用ECharts和Python接口绘制仪表盘的步骤
Dec 18, 2023 am 08:40 AM
使用ECharts和Python接口绘制仪表盘的步骤,需要具体代码示例摘要:ECharts是一款优秀的数据可视化工具,通过Python接口可以方便地进行数据处理和图形绘制。本文将介绍使用ECharts和Python接口绘制仪表盘的具体步骤,并提供示例代码。关键词:ECharts、Python接口、仪表盘、数据可视化简介仪表盘是一种常用的数据可视化形式,它通过
 如何利用php接口和ECharts生成可视化的统计图表
Dec 18, 2023 am 11:39 AM
在今天数据可视化变得越来越重要的背景下,许多开发者都希望能够利用各种工具,快速生成各种图表与报表,以便能够更好的展示数据,帮助决策者快速做出判断。而在此背景下,利用Php接口和ECharts库可以帮助许多开发者快速生成可视化的统计图表。本文将详细介绍如何利用Php接口和ECharts库生成可视化的统计图表。在具体实现时,我们将使用MySQL
 如何在ECharts中使用地图热力图展示城市热度
Dec 18, 2023 pm 04:00 PM
如何在ECharts中使用地图热力图展示城市热度ECharts是一款功能强大的可视化图表库,它提供了各种图表类型供开发人员使用,包括地图热力图。地图热力图可以用于展示城市或地区的热度,帮助我们快速了解不同地方的热门程度或密集程度。本文将介绍如何使用ECharts中的地图热力图来展示城市热度,并提供代码示例供参考。首先,我们需要一个包含地理信息的地图文件,EC
 PHP、Vue和React:如何选择最适合的前端框架?
Mar 15, 2024 pm 05:48 PM
PHP、Vue和React:如何选择最适合的前端框架?随着互联网技术的不断发展,前端框架在Web开发中起着至关重要的作用。PHP、Vue和React作为三种具有代表性的前端框架,每一种都具有其独特的特点和优势。在选择使用哪种前端框架时,开发人员需要根据项目需求、团队技能和个人偏好做出明智的决策。本文将通过比较PHP、Vue和React这三种前端框架的特点和使
 Java框架与前端React框架的整合
Jun 01, 2024 pm 03:16 PM
Java框架与React框架的整合:步骤:设置后端Java框架。创建项目结构。配置构建工具。创建React应用。编写RESTAPI端点。配置通信机制。实战案例(SpringBoot+React):Java代码:定义RESTfulAPI控制器。React代码:获取并显示API返回的数据。
 如何在ECharts中使用日历图展示时间数据
Dec 18, 2023 am 08:52 AM
如何在ECharts中使用日历图展示时间数据ECharts(百度开源的JavaScript图表库)是一种功能强大且易于使用的数据可视化工具。它提供了各种图表类型,包括折线图、柱状图、饼图等。而日历图是ECharts中一个很有特色且实用的图表类型,它可以用来展示与时间相关的数据。本文将介绍如何在ECharts中使用日历图,并提供具体的代码示例。首先,你需要使用
 ECharts和golang技术指南: 创建各类统计图表的实用秘籍
Dec 17, 2023 pm 09:56 PM
ECharts和golang技术指南:创建各类统计图表的实用秘籍,需要具体代码示例导语:在现代化的数据可视化领域,统计图表是数据分析和可视化的重要工具。ECharts是一个强大的数据可视化库,而golang是一种快速,可靠且高效的编程语言。本文将向您介绍如何使用ECharts和golang创建各种类型的统计图表,并提供代码示例,帮助您掌握这一技能。准备工作


