可视化 | 再分享一套Flask+Pyecharts可视化模板二
本期再给大家分享一套适合初学者的<span style="color: rgb(221, 0, 0);text-decoration: underline;outline: 0px;font-weight: 700;font-size: inherit;"><Flask+Pyecharts可视化模板二><code style='outline: 0px;font-family: "Source Code Pro", "DejaVu Sans Mono", "Ubuntu Mono", "Anonymous Pro", "Droid Sans Mono", Menlo, Monaco, Consolas, Inconsolata, Courier, monospace, "PingFang SC", "Microsoft YaHei", sans-serif;font-size: 14px;line-height: 22px;color: rgb(199, 37, 78);background-color: rgb(249, 242, 244);border-radius: 2px;padding: 2px 4px;font-variant-ligatures: no-common-ligatures;text-align: start;white-space: normal;'><span style="color: rgb(221, 0, 0);text-decoration: underline;outline: 0px;font-weight: 700;font-size: inherit;"><Flask+Pyecharts可视化模板二></span>,希望对你有所帮助,如有疑问或者需要改进的地方可以私信小编。
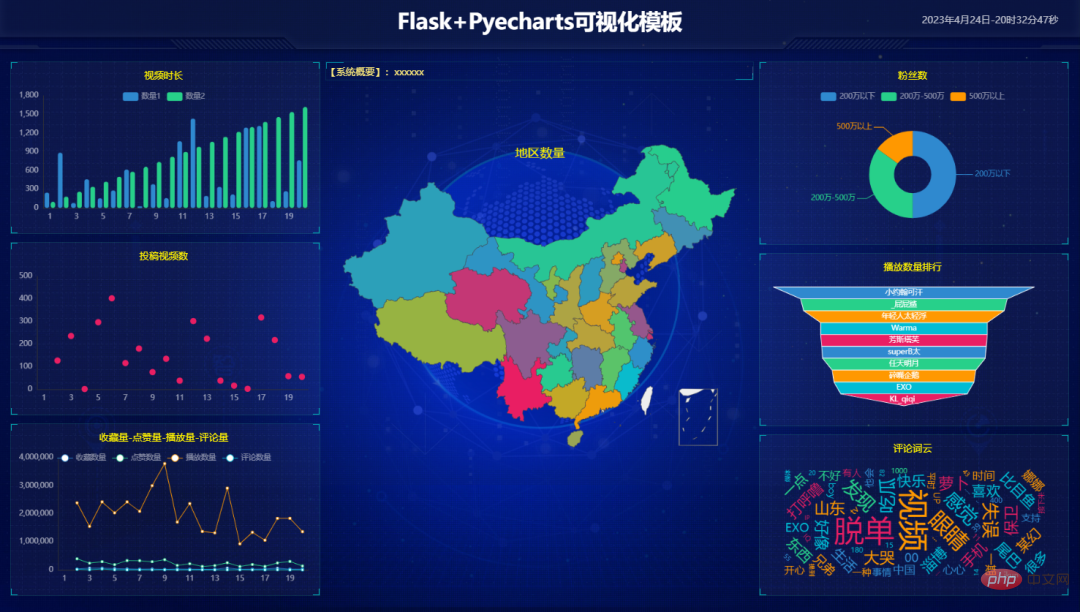
?️? 1. 系统说明界面

def get_bar():
    x_data = df['排名'].values.tolist()
    y_data = df['时长(s)'].values.tolist()
    bar = (
        Bar()
            .add_xaxis(x_data)
            .add_yaxis(
                '数量1',
                y_data,
                label_opts=opts.LabelOpts(is_show=False)
            )
            .set_global_opts(
                legend_opts=opts.LegendOpts(
                    textstyle_opts=opts.TextStyleOpts(color='rgba(255,255,255,.5)',font_size=12)
                ),
                tooltip_opts=opts.TooltipOpts(
                    is_show=True, trigger="axis", axis_pointer_type="cross"
                ),
                xaxis_opts=opts.AxisOpts(
                    axislabel_opts=opts.LabelOpts(font_size=12, color="rgba(255,255,255,.6)"),
                    axistick_opts=opts.AxisTickOpts(is_show=False),
                ),
                yaxis_opts=opts.AxisOpts(
                    axislabel_opts=opts.LabelOpts(font_size=12, color="rgba(255,255,255,.6)"),
                    axistick_opts=opts.AxisTickOpts(is_show=False),
                )
        )
    )
    title = "视频时长"
    return bar, title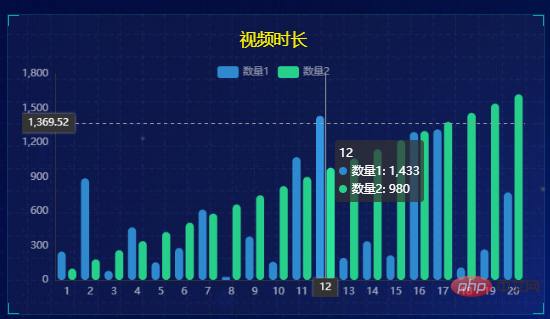
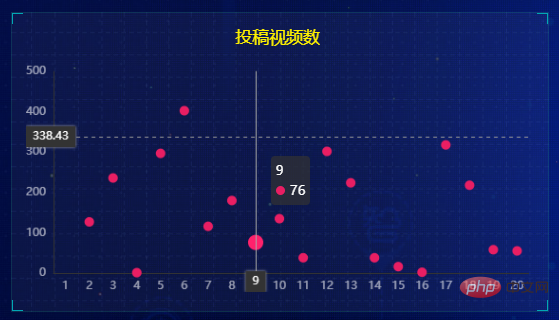
?️? 4. 折线图示例界面
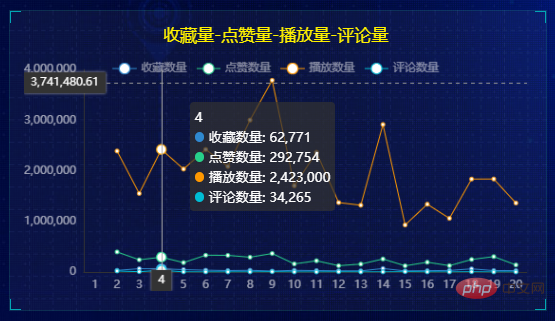
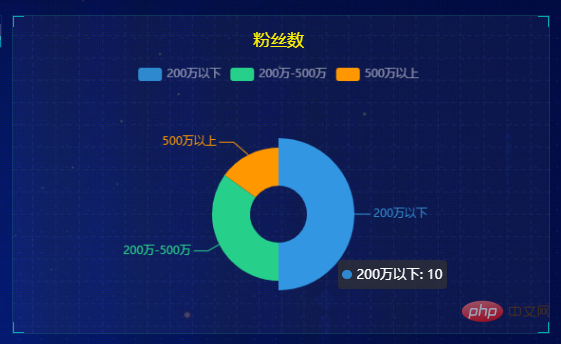
?️? 5. 饼图示例界面
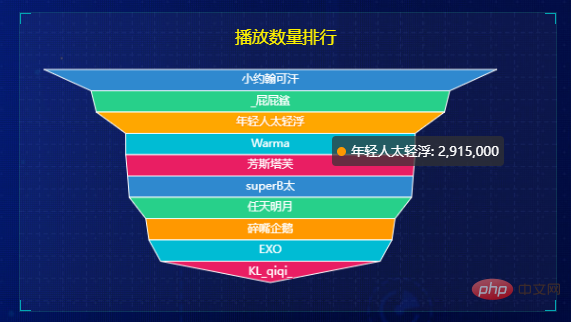
?️? 6. 锥形图示例界面
?️? 7. 词云图示例界面

?️? 8. 地图示例界面
def get_map():
    map1 = (
        Map()
        .add("", [list(z) for z in zip(regions, values)], "china",
             label_opts=opts.LabelOpts(is_show=False),
             is_map_symbol_show=False)
        .set_global_opts(
            title_opts=opts.TitleOpts(
                title='地区数量', pos_left='center', pos_top='10%',
                title_textstyle_opts=opts.TextStyleOpts(color='#fff200', font_size=20,font_weight='normal')
            ),
            visualmap_opts=opts.VisualMapOpts(
                is_show=False,
                pos_left='15%',
                pos_bottom='15%',
                range_color=colors
            ),
        )
    )
    title = "地区数量"
    return map1, title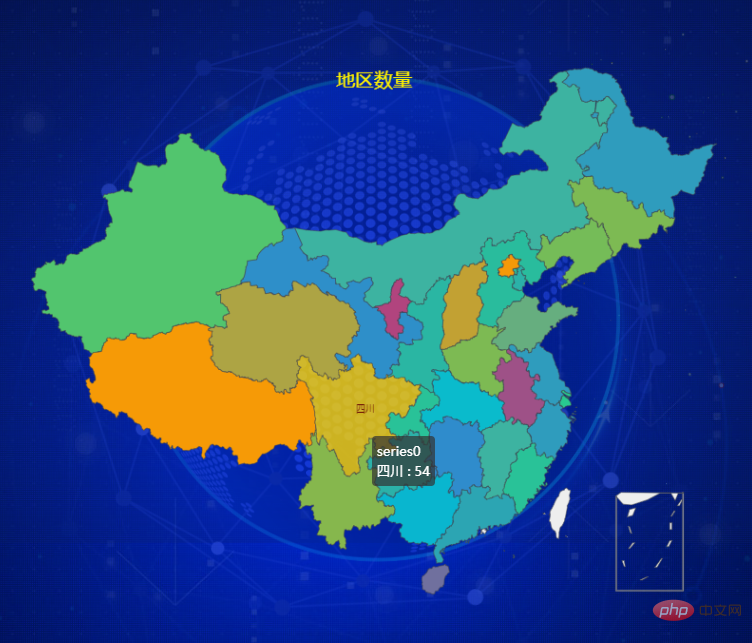
以上各图内容均可根据自己的需要进行调整。
以上是可视化 | 再分享一套Flask+Pyecharts可视化模板二的详细内容。更多信息请关注PHP中文网其他相关文章!

热AI工具

Undresser.AI Undress
人工智能驱动的应用程序,用于创建逼真的裸体照片

AI Clothes Remover
用于从照片中去除衣服的在线人工智能工具。

Undress AI Tool
免费脱衣服图片

Clothoff.io
AI脱衣机

AI Hentai Generator
免费生成ai无尽的。

热门文章

热工具

记事本++7.3.1
好用且免费的代码编辑器

SublimeText3汉化版
中文版,非常好用

禅工作室 13.0.1
功能强大的PHP集成开发环境

Dreamweaver CS6
视觉化网页开发工具

SublimeText3 Mac版
神级代码编辑软件(SublimeText3)

热门话题
 mysql 是否要付费
Apr 08, 2025 pm 05:36 PM
MySQL 有免费的社区版和收费的企业版。社区版可免费使用和修改,但支持有限,适合稳定性要求不高、技术能力强的应用。企业版提供全面商业支持,适合需要稳定可靠、高性能数据库且愿意为支持买单的应用。选择版本时考虑的因素包括应用关键性、预算和技术技能。没有完美的选项,只有最合适的方案,需根据具体情况谨慎选择。
 mysql安装后怎么使用
Apr 08, 2025 am 11:48 AM
文章介绍了MySQL数据库的上手操作。首先,需安装MySQL客户端,如MySQLWorkbench或命令行客户端。1.使用mysql-uroot-p命令连接服务器,并使用root账户密码登录;2.使用CREATEDATABASE创建数据库,USE选择数据库;3.使用CREATETABLE创建表,定义字段及数据类型;4.使用INSERTINTO插入数据,SELECT查询数据,UPDATE更新数据,DELETE删除数据。熟练掌握这些步骤,并学习处理常见问题和优化数据库性能,才能高效使用MySQL。
 mySQL下载完安装不了
Apr 08, 2025 am 11:24 AM
MySQL安装失败的原因主要有:1.权限问题,需以管理员身份运行或使用sudo命令;2.依赖项缺失,需安装相关开发包;3.端口冲突,需关闭占用3306端口的程序或修改配置文件;4.安装包损坏,需重新下载并验证完整性;5.环境变量配置错误,需根据操作系统正确配置环境变量。解决这些问题,仔细检查每个步骤,就能顺利安装MySQL。
 mysql下载文件损坏无法安装的修复方案
Apr 08, 2025 am 11:21 AM
MySQL下载文件损坏,咋整?哎,下载个MySQL都能遇到文件损坏,这年头真是不容易啊!这篇文章就来聊聊怎么解决这个问题,让大家少走弯路。读完之后,你不仅能修复损坏的MySQL安装包,还能对下载和安装过程有更深入的理解,避免以后再踩坑。先说说为啥下载文件会损坏这原因可多了去了,网络问题是罪魁祸首,下载过程中断、网络不稳定都可能导致文件损坏。还有就是下载源本身的问题,服务器文件本身就坏了,你下载下来当然也是坏的。另外,一些杀毒软件过度“热情”的扫描也可能造成文件损坏。诊断问题:确定文件是否真的损坏
 mysql 需要互联网吗
Apr 08, 2025 pm 02:18 PM
MySQL 可在无需网络连接的情况下运行,进行基本的数据存储和管理。但是,对于与其他系统交互、远程访问或使用高级功能(如复制和集群)的情况,则需要网络连接。此外,安全措施(如防火墙)、性能优化(选择合适的网络连接)和数据备份对于连接到互联网的 MySQL 数据库至关重要。
 如何针对高负载应用程序优化 MySQL 性能?
Apr 08, 2025 pm 06:03 PM
MySQL数据库性能优化指南在资源密集型应用中,MySQL数据库扮演着至关重要的角色,负责管理海量事务。然而,随着应用规模的扩大,数据库性能瓶颈往往成为制约因素。本文将探讨一系列行之有效的MySQL性能优化策略,确保您的应用在高负载下依然保持高效响应。我们将结合实际案例,深入讲解索引、查询优化、数据库设计以及缓存等关键技术。1.数据库架构设计优化合理的数据库架构是MySQL性能优化的基石。以下是一些核心原则:选择合适的数据类型选择最小的、符合需求的数据类型,既能节省存储空间,又能提升数据处理速度
 MySQL安装后服务无法启动的解决办法
Apr 08, 2025 am 11:18 AM
MySQL拒启动?别慌,咱来排查!很多朋友安装完MySQL后,发现服务死活启动不了,心里那个急啊!别急,这篇文章带你从容应对,揪出幕后黑手!读完后,你不仅能解决这个问题,还能提升对MySQL服务的理解,以及排查问题的思路,成为一名更强大的数据库管理员!MySQL服务启动失败,原因五花八门,从简单的配置错误到复杂的系统问题都有可能。咱们先从最常见的几个方面入手。基础知识:服务启动流程简述MySQL服务启动,简单来说,就是操作系统加载MySQL相关的文件,然后启动MySQL守护进程。这其中涉及到配置
 mysql安装后怎么优化数据库性能
Apr 08, 2025 am 11:36 AM
MySQL性能优化需从安装配置、索引及查询优化、监控与调优三个方面入手。1.安装后需根据服务器配置调整my.cnf文件,例如innodb_buffer_pool_size参数,并关闭query_cache_size;2.创建合适的索引,避免索引过多,并优化查询语句,例如使用EXPLAIN命令分析执行计划;3.利用MySQL自带监控工具(SHOWPROCESSLIST,SHOWSTATUS)监控数据库运行状况,定期备份和整理数据库。通过这些步骤,持续优化,才能提升MySQL数据库性能。


