Python-matplotlib | 绘制双y轴图形(图例设置)
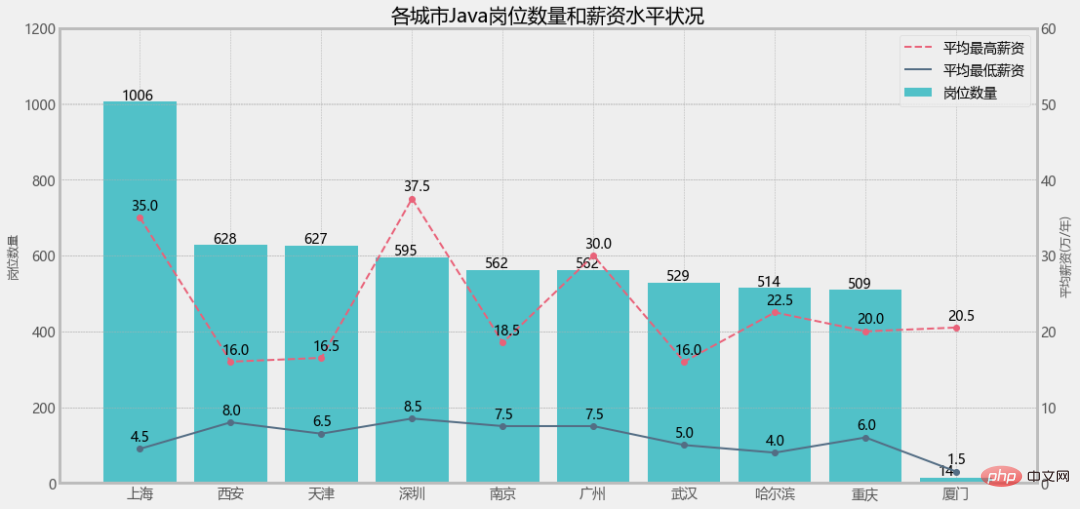
df = pd.read_csv('jobdata.csv')
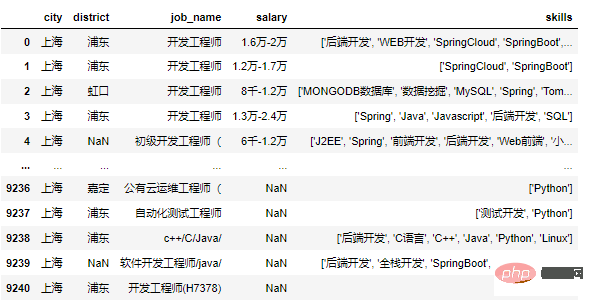
1. 岗位数量折线图
colors = ["#51C1C8", "#536D84","#E96279"]
plt.figure(figsize=(16, 8))
ax1 = plt.subplot(111)
ax1.set_ylim(0,1200)
lin0 = ax1.plot(x_data, y_data1, marker='o', color=colors[0], label='岗位数量')
for x, y in enumerate(y_data1):
    plt.text(x - 0.2, y+5, y)
ax1.set_ylabel('岗位数量',fontsize=12)
plt.legend()
plt.title("各城市Java岗位数量")
plt.show()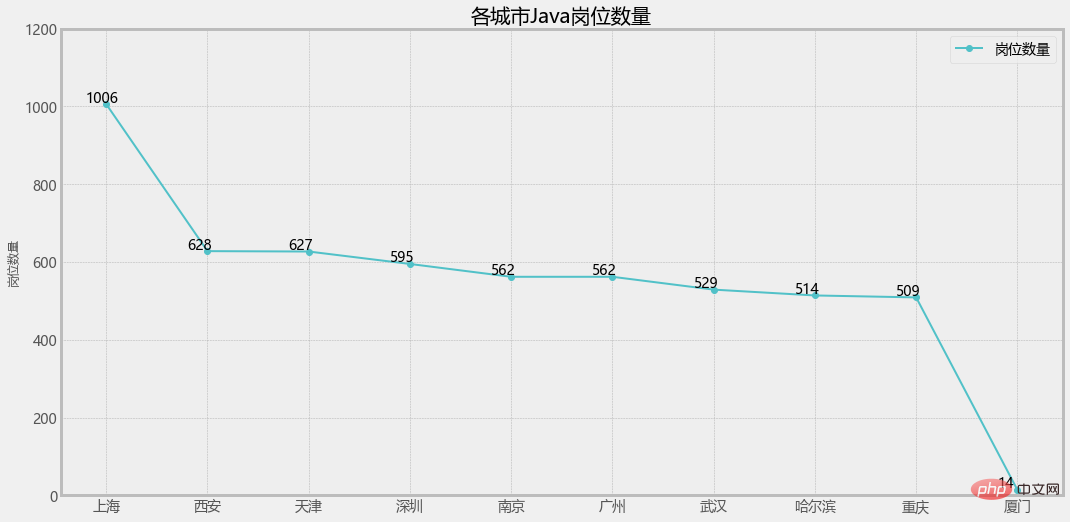
2. 通过 ax1.twinx() 增加一个y轴:
# 增加y轴
ax2 = ax1.twinx()

ax2.set_ylim(0,60)
lin1 = ax2.plot(x_data, y_data2, linestyle='--', marker='o', c=colors[1], label='平均最低薪资')
for x, y in enumerate(y_data2):
    plt.text(x - 0.1, y+1, y)
lin2 = ax2.plot(x_data, y_data3, linestyle='--', marker='o', c=colors[2], label='平均最高薪资')
for x, y in enumerate(y_data3):
    plt.text(x - 0.1, y+1, y)
ax2.set_ylabel('平均薪资(万/年)',fontsize=12)
plt.legend()
plt.title("各城市Java岗位数量和薪资水平状况")
plt.show()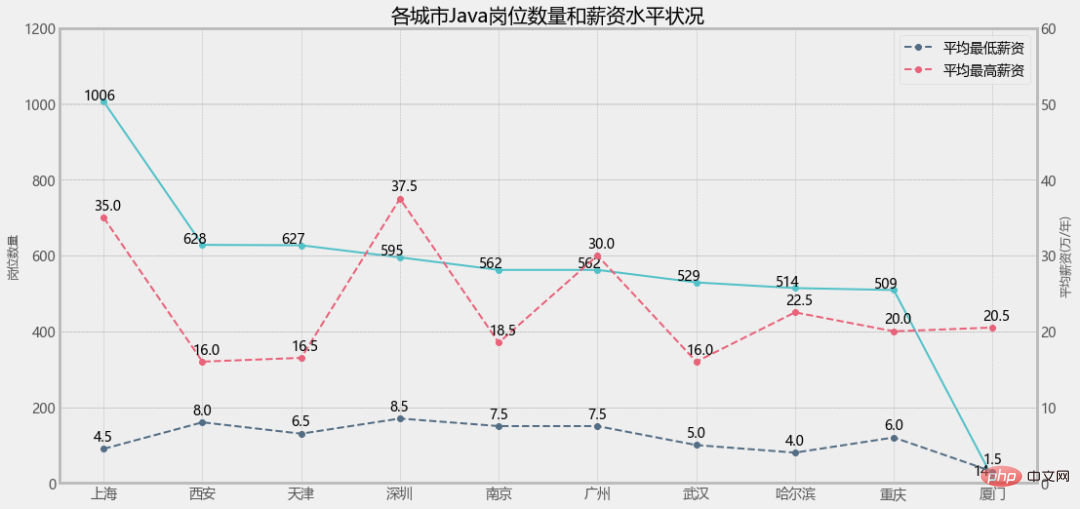
3. 单独设置图例
ax1.legend(loc='best')
ax2.legend(loc='best')
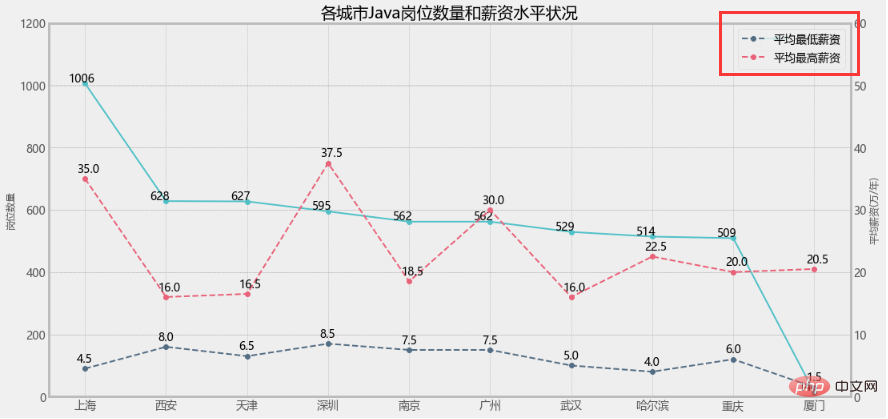
ax1.legend(loc=2)
ax2.legend(loc=1)
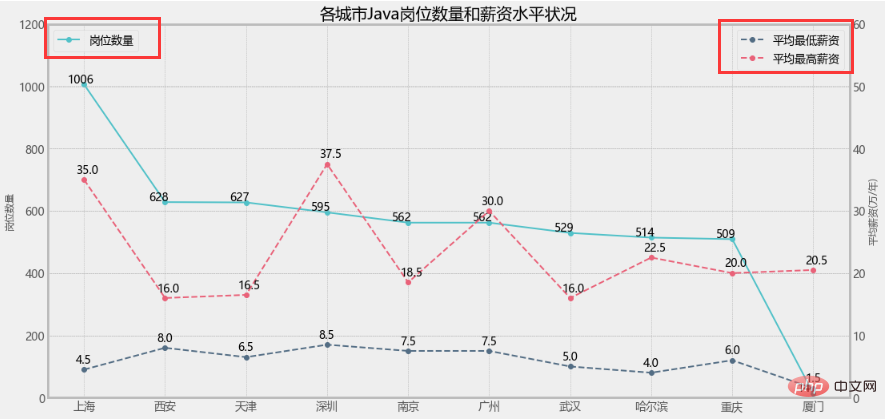
这样看就比较直观了,但是我就想把三个图例放一起不可以吗?
当然可以!
3. 设置组合图例
lines = lin0+lin1+lin2
labs = [label.get_label() for label in lines]
plt.legend(lines,labs)
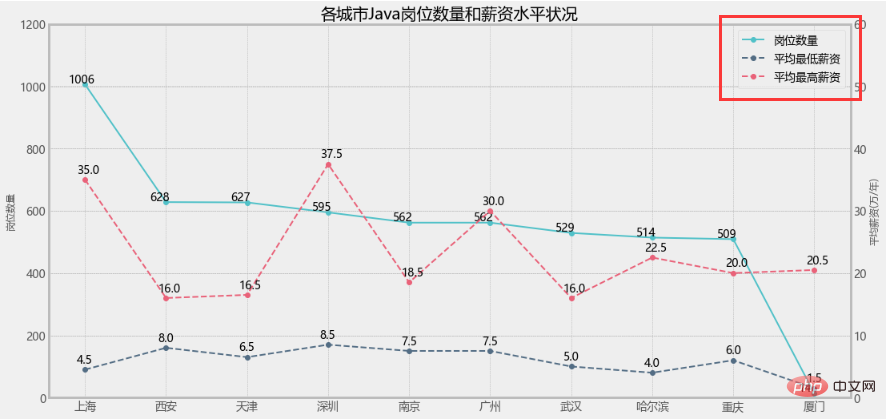
大功告成!
但是!如果是柱状图+折线图的情况,效果还一样吗?
但是!如果是柱状图+折线图的情况,效果还一样吗?
但是!如果是柱状图+折线图的情况,效果还一样吗?
1. 修改岗位数量为柱状图
plt.figure(figsize=(16, 8))
a1 = plt.subplot(111)
a1.set_ylim(0,1200)
bar = a1.bar(x_data, y_data1, color=colors[0], label='岗位数量')
for x, y in enumerate(y_data1):
    plt.text(x - 0.2, y+5, y)
a1.set_ylabel('岗位数量',fontsize=12)

...

lines = bar+lin1+lin2
labs = [label.get_label() for label in lines]
plt.legend(lines,labs)直接报错了!


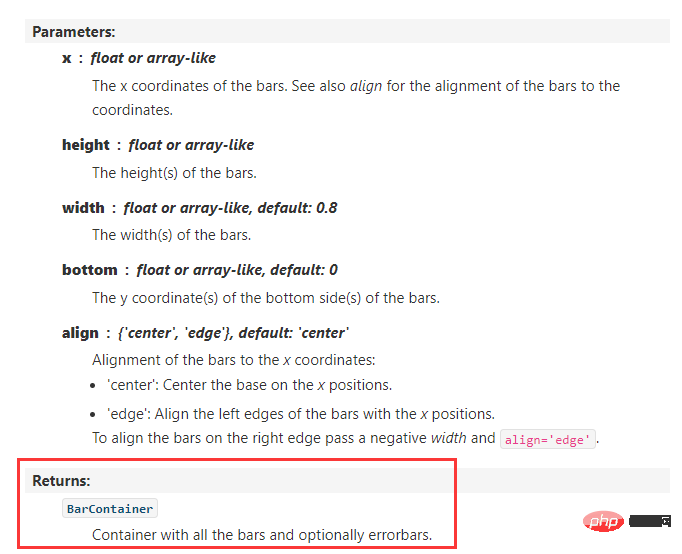
提示类型不一致,显然是bar和line的类型问题,我们查一下源码:
matplotlib.axes.Axes.plot:
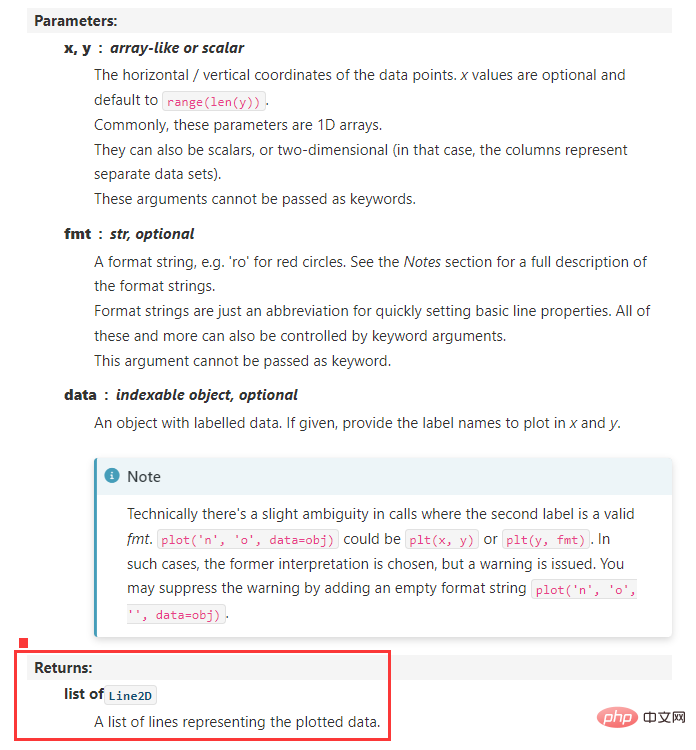
matplotlib.axes.Axes.bar:
2. 设置Line2D和patches的组合图例
legend_handles = [
    Line2D([], [], linewidth=1, ls='--', lw=2, c=colors[2], label='平均最高薪资'),
    Line2D([], [], linewidth=1, lw=2, c=colors[1], label='平均最低薪资'),
    patches.Rectangle((0, 0), 1, 1, facecolor=colors[0],label='岗位数量')
]
plt.legend(handles=legend_handles, loc='best', fontsize=14)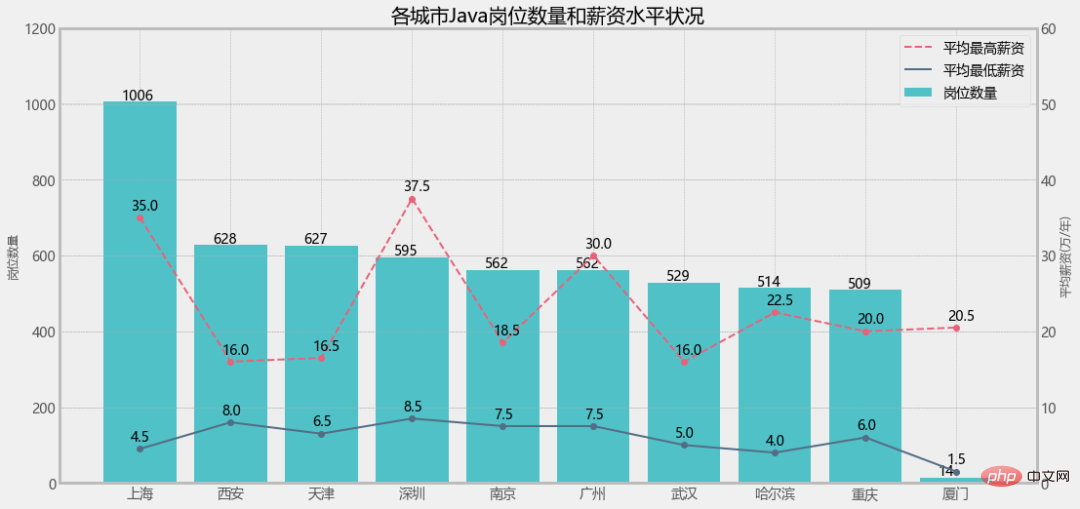
以上是Python-matplotlib | 绘制双y轴图形(图例设置)的详细内容。更多信息请关注PHP中文网其他相关文章!

热AI工具

Undresser.AI Undress
人工智能驱动的应用程序,用于创建逼真的裸体照片

AI Clothes Remover
用于从照片中去除衣服的在线人工智能工具。

Undress AI Tool
免费脱衣服图片

Clothoff.io
AI脱衣机

AI Hentai Generator
免费生成ai无尽的。

热门文章

热工具

记事本++7.3.1
好用且免费的代码编辑器

SublimeText3汉化版
中文版,非常好用

禅工作室 13.0.1
功能强大的PHP集成开发环境

Dreamweaver CS6
视觉化网页开发工具

SublimeText3 Mac版
神级代码编辑软件(SublimeText3)

热门话题
 mysql 是否要付费
Apr 08, 2025 pm 05:36 PM
MySQL 有免费的社区版和收费的企业版。社区版可免费使用和修改,但支持有限,适合稳定性要求不高、技术能力强的应用。企业版提供全面商业支持,适合需要稳定可靠、高性能数据库且愿意为支持买单的应用。选择版本时考虑的因素包括应用关键性、预算和技术技能。没有完美的选项,只有最合适的方案,需根据具体情况谨慎选择。
 mysql安装后怎么使用
Apr 08, 2025 am 11:48 AM
文章介绍了MySQL数据库的上手操作。首先,需安装MySQL客户端,如MySQLWorkbench或命令行客户端。1.使用mysql-uroot-p命令连接服务器,并使用root账户密码登录;2.使用CREATEDATABASE创建数据库,USE选择数据库;3.使用CREATETABLE创建表,定义字段及数据类型;4.使用INSERTINTO插入数据,SELECT查询数据,UPDATE更新数据,DELETE删除数据。熟练掌握这些步骤,并学习处理常见问题和优化数据库性能,才能高效使用MySQL。
 mysql下载文件损坏无法安装的修复方案
Apr 08, 2025 am 11:21 AM
MySQL下载文件损坏,咋整?哎,下载个MySQL都能遇到文件损坏,这年头真是不容易啊!这篇文章就来聊聊怎么解决这个问题,让大家少走弯路。读完之后,你不仅能修复损坏的MySQL安装包,还能对下载和安装过程有更深入的理解,避免以后再踩坑。先说说为啥下载文件会损坏这原因可多了去了,网络问题是罪魁祸首,下载过程中断、网络不稳定都可能导致文件损坏。还有就是下载源本身的问题,服务器文件本身就坏了,你下载下来当然也是坏的。另外,一些杀毒软件过度“热情”的扫描也可能造成文件损坏。诊断问题:确定文件是否真的损坏
 mySQL下载完安装不了
Apr 08, 2025 am 11:24 AM
MySQL安装失败的原因主要有:1.权限问题,需以管理员身份运行或使用sudo命令;2.依赖项缺失,需安装相关开发包;3.端口冲突,需关闭占用3306端口的程序或修改配置文件;4.安装包损坏,需重新下载并验证完整性;5.环境变量配置错误,需根据操作系统正确配置环境变量。解决这些问题,仔细检查每个步骤,就能顺利安装MySQL。
 如何针对高负载应用程序优化 MySQL 性能?
Apr 08, 2025 pm 06:03 PM
MySQL数据库性能优化指南在资源密集型应用中,MySQL数据库扮演着至关重要的角色,负责管理海量事务。然而,随着应用规模的扩大,数据库性能瓶颈往往成为制约因素。本文将探讨一系列行之有效的MySQL性能优化策略,确保您的应用在高负载下依然保持高效响应。我们将结合实际案例,深入讲解索引、查询优化、数据库设计以及缓存等关键技术。1.数据库架构设计优化合理的数据库架构是MySQL性能优化的基石。以下是一些核心原则:选择合适的数据类型选择最小的、符合需求的数据类型,既能节省存储空间,又能提升数据处理速度
 MySQL安装后服务无法启动的解决办法
Apr 08, 2025 am 11:18 AM
MySQL拒启动?别慌,咱来排查!很多朋友安装完MySQL后,发现服务死活启动不了,心里那个急啊!别急,这篇文章带你从容应对,揪出幕后黑手!读完后,你不仅能解决这个问题,还能提升对MySQL服务的理解,以及排查问题的思路,成为一名更强大的数据库管理员!MySQL服务启动失败,原因五花八门,从简单的配置错误到复杂的系统问题都有可能。咱们先从最常见的几个方面入手。基础知识:服务启动流程简述MySQL服务启动,简单来说,就是操作系统加载MySQL相关的文件,然后启动MySQL守护进程。这其中涉及到配置
 mysql安装后怎么优化数据库性能
Apr 08, 2025 am 11:36 AM
MySQL性能优化需从安装配置、索引及查询优化、监控与调优三个方面入手。1.安装后需根据服务器配置调整my.cnf文件,例如innodb_buffer_pool_size参数,并关闭query_cache_size;2.创建合适的索引,避免索引过多,并优化查询语句,例如使用EXPLAIN命令分析执行计划;3.利用MySQL自带监控工具(SHOWPROCESSLIST,SHOWSTATUS)监控数据库运行状况,定期备份和整理数据库。通过这些步骤,持续优化,才能提升MySQL数据库性能。
 mysql 需要互联网吗
Apr 08, 2025 pm 02:18 PM
MySQL 可在无需网络连接的情况下运行,进行基本的数据存储和管理。但是,对于与其他系统交互、远程访问或使用高级功能(如复制和集群)的情况,则需要网络连接。此外,安全措施(如防火墙)、性能优化(选择合适的网络连接)和数据备份对于连接到互联网的 MySQL 数据库至关重要。


