如何使用Python-Plotly制作基本的散点图?
有时,任务是分析数据集并使用图表或绘图进行数据可视化。 Plotly 是一个很好的开源图形库,可以与 Python 一起使用,用于快速轻松地制作各种绘图和图表。在本文中,使用两个不同的示例,将名为 Plotly 的 Python 库与 Python 代码结合使用来绘制散点图。在第一个示例中,计算机系统中安装的Python用于运行为制作散点图而编写的Python程序。另一个例子,使用Google Colab展示了在计算机中没有安装Python的情况下,仍然可以使用Python和Plotly并可以制作散点图的方法。在这两个示例中,都使用 Kaggle 的开源数据集进行数据分析和可视化。
使用的 IRIS.csv 文件
sepal_length,sepal_width,petal_length,petal_width,species
5.1,3.5,1.4,0.2,Iris-setosa
4.9,3,1.4,0.2,Iris-setosa
4.7,3.2,1.3,0.2,Iris-setosa
4.6,3.1,1.5,0.2,Iris-setosa
5,3.6,1.4,0.2,Iris-setosa
5.4,3.9,1.7,0.4,Iris-setosa
4.6,3.4,1.4,0.3,Iris-setosa
5,3.4,1.5,0.2,Iris-setosa
4.4,2.9,1.4,0.2,Iris-setosa
…….., ….., ……, ……., ……..
此 CSV 文件包含名为 sepal_length、sepal_width、petal_length、petal_width 和species 的五列。其中,我们将在示例 1 中使用 sepal_width 和 petal_width 作为散点图,在示例 2 中使用 sepal_length 和 petal_length 作为散点图。
示例 1:使用 Python 和 Plotly 制作散点图
设计步骤和编码
第 1 步 - 首先导入 pandas 并绘制。 Plotly 是 Python 的开源图形库,将用于制作散点图。
步骤 2 - 现在读取 IRIS.csv 文件,因为此处给出的数据集将用于制作散点图。
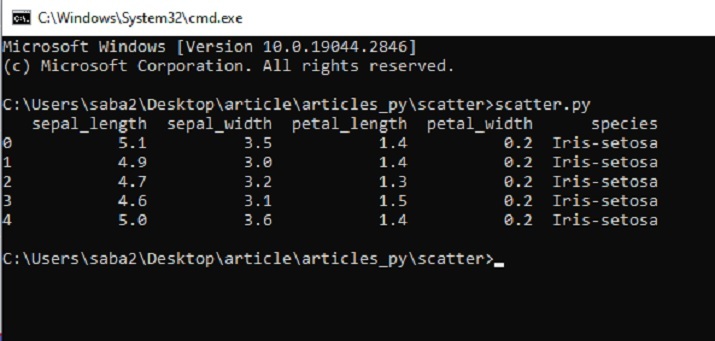
第 3 步 - 制作一个数据框 dff 并显示该数据框的列和内容。
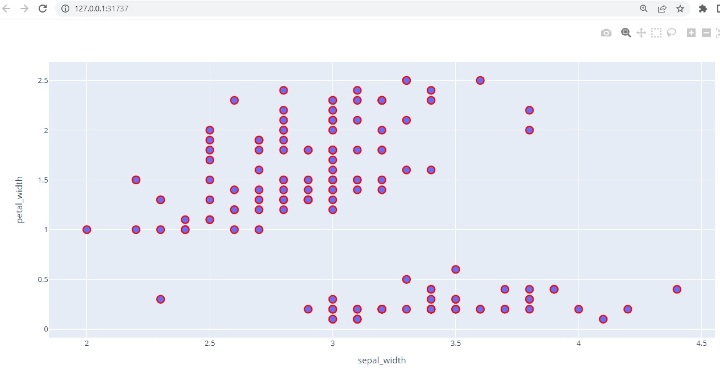
第 4 步 - 使用 scatter() 函数绘制散点图,并指定 x 轴的 sepal_width 和 y 轴的 petal_width。
第 5 步 - 设置标记的样式,例如大小和颜色。
第 6 步 - 编写函数来显示散点图。使用 cmd 窗口运行程序。该图将在浏览器的新选项卡中打开。
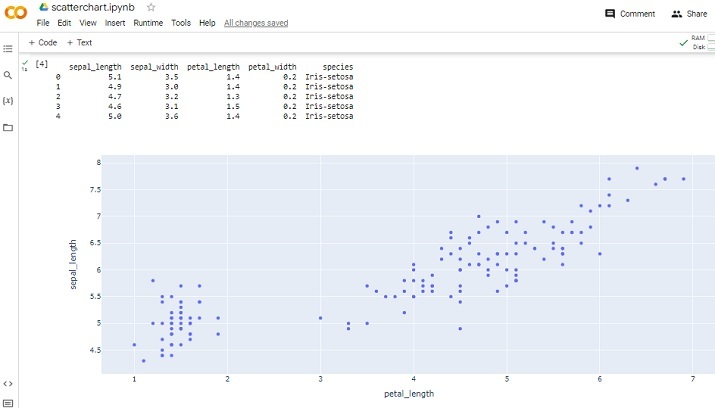
示例 2:在 Google Colab 上使用 Python 和 Plotly 制作散点图
设计步骤和编码
第 1 步 - 使用 Google 帐户登录。前往谷歌 Colab。打开一个新的 Colab Notebook 并在其中编写 Python 代码。
第 2 步 - 使用示例 1 中给出的链接上传从 Kaggle 下载并保存的 IRIS.csv 文件,因为此处给出的数据集将用于制作散点图。
第 3 步 - 现在导入 pandas 并绘制。 Plotly 是 Python 的开源图形库,将用于制作散点图。
第 4 步 - 制作一个数据框 dff 并显示该数据框的列和内容。
第 5 步 - 使用 scatter() 函数绘制散点图,并指定 x 轴的 petal_length 和 y 轴的 sepal_length。
第 6 步 - 编写函数来显示散点图。通过单击给定代码单元上的播放按钮来运行程序。检查结果,因为它将显示在 Colab 笔记本中。
示例 1:使用 Python 和 Plotly 制作散点图
保存数据分析所需的数据文件/csv文件
为了制作散点图,我们将使用 Kaggle 上的可用数据。登录 Kaggle 并从此链接下载 CSV 文件 -
创建一个名为 Scatter.py 的文件。在该文件中写入以下代码
#include the required libraries
import pandas as pd

#This library is needed to make the scatter plot
import plotly.express as pxx

#read the CSV file and make a dataframe
dff = pd.read_csv("IRIS.csv")

#print the columns and data

print(dff.head())

#make the scatter plot
figg = pxx.scatter(dff, x="sepal_width", y="petal_width")

#set the properties of the scatter plot
figg.update_traces(marker=dict(size=12, line=dict(width=2, color="red")), selector=dict(mode='markers'))

#display the chart
figg.show()
在命令行窗口中运行 Python 文件

查看结果 - 示例 1

示例 1:在 Google Colab 上使用 Python 制作散点图
上传数据,CSV 文件
#Uploading the csv
from google.colab import dfiles
data_to_load = dfiles.upload()
包含库并读取 CSV 文件
import pandas as pdd
import plotly.express as pxx

dff = pdd.read_csv("IRIS.csv")
打印结果并显示散点图
print(dff.head())
figg = pxx.scatter(dff, x="petal_length", y="sepal_length")
figg.show()
查看结果

在这篇 Python 和 Plotly 文章中,通过两个不同的示例,给出了如何使用名为 Plotly 的 Python 库制作散点图的方法。首先,给出了从 Kaggle 下载并保存数据集进行分析的方法。然后编写一个 Python 程序来使用 Plotly 中的函数绘制散点图。在第二个示例中,使用 Google Colab 编写 Python 程序并使用相同的库和相同的数据集制作散点图。
以上是如何使用Python-Plotly制作基本的散点图?的详细内容。更多信息请关注PHP中文网其他相关文章!

热AI工具

Undresser.AI Undress
人工智能驱动的应用程序,用于创建逼真的裸体照片

AI Clothes Remover
用于从照片中去除衣服的在线人工智能工具。

Undress AI Tool
免费脱衣服图片

Clothoff.io
AI脱衣机

Video Face Swap
使用我们完全免费的人工智能换脸工具轻松在任何视频中换脸!

热门文章

热工具

记事本++7.3.1
好用且免费的代码编辑器

SublimeText3汉化版
中文版,非常好用

禅工作室 13.0.1
功能强大的PHP集成开发环境

Dreamweaver CS6
视觉化网页开发工具

SublimeText3 Mac版
神级代码编辑软件(SublimeText3)
 PHP和Python:解释了不同的范例
Apr 18, 2025 am 12:26 AM
PHP主要是过程式编程,但也支持面向对象编程(OOP);Python支持多种范式,包括OOP、函数式和过程式编程。PHP适合web开发,Python适用于多种应用,如数据分析和机器学习。
 在PHP和Python之间进行选择:指南
Apr 18, 2025 am 12:24 AM
PHP适合网页开发和快速原型开发,Python适用于数据科学和机器学习。1.PHP用于动态网页开发,语法简单,适合快速开发。2.Python语法简洁,适用于多领域,库生态系统强大。
 PHP和Python:深入了解他们的历史
Apr 18, 2025 am 12:25 AM
PHP起源于1994年,由RasmusLerdorf开发,最初用于跟踪网站访问者,逐渐演变为服务器端脚本语言,广泛应用于网页开发。Python由GuidovanRossum于1980年代末开发,1991年首次发布,强调代码可读性和简洁性,适用于科学计算、数据分析等领域。
 Python vs. JavaScript:学习曲线和易用性
Apr 16, 2025 am 12:12 AM
Python更适合初学者,学习曲线平缓,语法简洁;JavaScript适合前端开发,学习曲线较陡,语法灵活。1.Python语法直观,适用于数据科学和后端开发。2.JavaScript灵活,广泛用于前端和服务器端编程。
 sublime怎么运行代码python
Apr 16, 2025 am 08:48 AM
在 Sublime Text 中运行 Python 代码,需先安装 Python 插件,再创建 .py 文件并编写代码,最后按 Ctrl B 运行代码,输出会在控制台中显示。
 vscode在哪写代码
Apr 15, 2025 pm 09:54 PM
在 Visual Studio Code(VSCode)中编写代码简单易行,只需安装 VSCode、创建项目、选择语言、创建文件、编写代码、保存并运行即可。VSCode 的优点包括跨平台、免费开源、强大功能、扩展丰富,以及轻量快速。
 Golang vs. Python:性能和可伸缩性
Apr 19, 2025 am 12:18 AM
Golang在性能和可扩展性方面优于Python。1)Golang的编译型特性和高效并发模型使其在高并发场景下表现出色。2)Python作为解释型语言,执行速度较慢,但通过工具如Cython可优化性能。
 visual studio code 可以用于 python 吗
Apr 15, 2025 pm 08:18 PM
VS Code 可用于编写 Python,并提供许多功能,使其成为开发 Python 应用程序的理想工具。它允许用户:安装 Python 扩展,以获得代码补全、语法高亮和调试等功能。使用调试器逐步跟踪代码,查找和修复错误。集成 Git,进行版本控制。使用代码格式化工具,保持代码一致性。使用 Linting 工具,提前发现潜在问题。


