

如何使用 Material UI 和 Devexpress 在 React 中创建条形图?

Material UI 是一个流行的 CSS 库,我们可以用它来设计 React 应用程序的样式。它包含各种预先设计样式的 React 组件,我们可以通过将它们导入到代码中来直接在应用程序中使用它们。
‘dx-react-chart-material-ui’是Devexpress的一个NPM包,可以连接devexpress的material-ui和‘dx-react-chart’库。 “dx-react-chart”用于创建图表,Material UI 用于设置图表样式。
用户可以执行以下命令在React应用程序中安装Material UI。
npm install @mui/material @emotion/react @emotion/styled
此外,执行以下命令来安装 Devexpress NPM 包。
npm i @devexpress/dx-react-chart
语法
用户可以按照以下语法使用 Devexpress 创建条形图。
<Chart data = {data}>
   <BarSeries valueField = "price" argumentField = "fruit" />
   <Title text = "Fruit price" />
</Chart>
在上面的语法中,我们使用了 DevExpress 的“Chart”、“BarSeries”和“Title”组件。 “Chart”组件显示图表,“BarSeries”组件显示条形图,“Title”组件显示标题。
示例 1(简单条形图)
在下面的示例中,我们从 Material UI 导入了“Paper”组件。此外,我们还从“devexpress”NPM 包中导入了所需的组件。
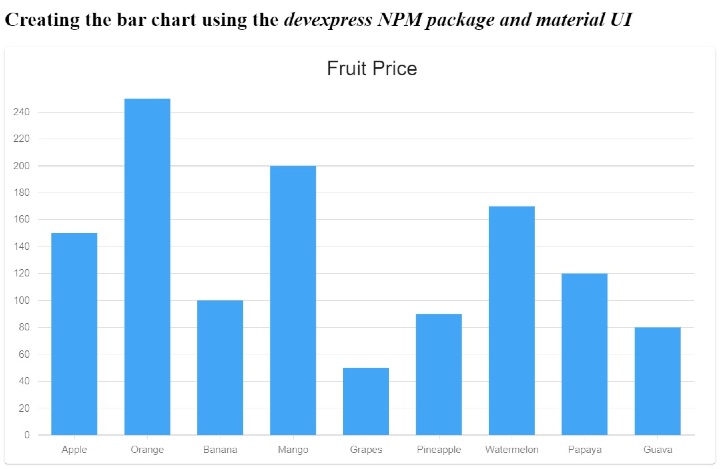
我们还定义了包含图表数据的 data[] 数组。它包含水果的名称和价格。我们创建一个简单的条形图来比较水果价格。在输出中,用户可以观察条形图。
import React, { useState } from "react";
import Paper from "@mui/material/Paper";
import {
   Chart,
   BarSeries,
   Title,
   ArgumentAxis,
   ValueAxis,
} from "@devexpress/dx-react-chart-material-ui";
import { Animation } from "@devexpress/dx-react-chart";

const data = [
   { fruit: "Apple", price: 150 },
   { fruit: "Orange", price: 250 },
   { fruit: "Banana", price: 100 },
   { fruit: "Mango", price: 200 },
   { fruit: "Grapes", price: 50 },
   { fruit: "Pineapple", price: 90 },
   { fruit: "Watermelon", price: 170 },
   { fruit: "Papaya", price: 120 },
   { fruit: "Guava", price: 80 },
];

function App() {
   return (
      <div>
         <h2>
            Creating the{" "}
            bar chart using the <i>  devexpress NPM   package and material UI </i>
         </h2>
         <Paper>
            <Chart data = {data}>
               <ArgumentAxis />
               <ValueAxis max = {200} />
               <BarSeries valueField = "price" argumentField = "fruit" />
               <Title text = "Fruit Price" />
               <Animation />
            </Chart>
         </Paper>
      </div>
   );
}
export default App;
输出
示例 2(并排条形图)
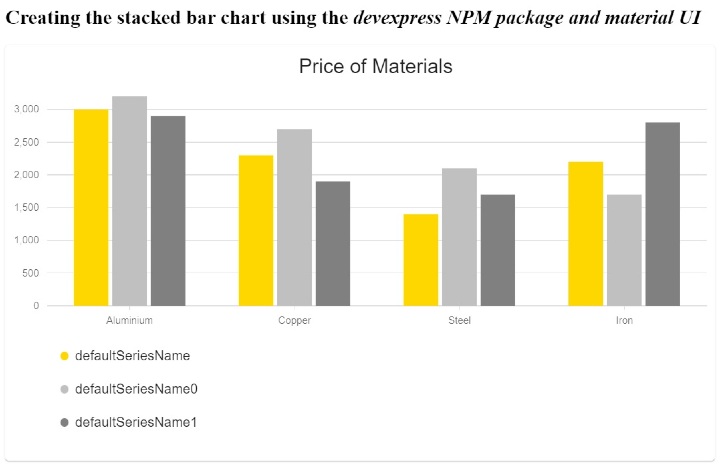
在下面的示例中,我们演示了如何创建并排条形图。该数据包含根据颜色的材料名称和价格。
该图表包含单一材料的一系列 3 个条形图,每个条形图代表不同的颜色。我们使用“Barseries”组件为每种材料创建一个条形。此外,我们还设置了组件的标题。
在输出中,用户可以观察并排的条形图,每个条形根据颜色比较不同材料的价格。
import React from "react";
import Paper from "@mui/material/Paper";
import {
   Chart,
   BarSeries,
   Title,
   ArgumentAxis,
   ValueAxis,
   Legend,
} from "@devexpress/dx-react-chart-material-ui";
import { Stack, Animation } from "@devexpress/dx-react-chart";

const chartData = [
   { material: "Aluminium", yellow: 3000, silver: 3200, grey: 2900 },
   { material: "Copper", yellow: 2300, silver: 2700, grey: 1900 },
   { material: "Steel", yellow: 1400, silver: 2100, grey: 1700 },
   { material: "Iron", yellow: 2200, silver: 1700, grey: 2800 },
];

function App() {
  return (
      <div>
      <h2>
         Creating the{" "}
         stacked bar chart using the <i> devexpress NPM package and material UI </i>
      </h2>
      <Paper>
         <Chart data = {chartData}>
            <ArgumentAxis />
            <ValueAxis />

            <BarSeries
               Name = "yellow color"
               valueField = "yellow"
               argumentField = "material"
               color = "#ffd700"
            />
            <BarSeries
               Name = "Silver color"
               valueField = "silver"
               argumentField = "material"
               color = "#c0c0c0"
            />
            <BarSeries
               Name = "grey color"
               valueField = "grey"
               argumentField = "material"
               color = "grey"
            />
            <Animation />
            <Legend position = "bottom" />
            <Title text = "Price of Materials" />
            <Stack />
         </Chart>
         </Paper>
      </div>
   );
}
export default App;
输出
示例 3(堆叠条形图)
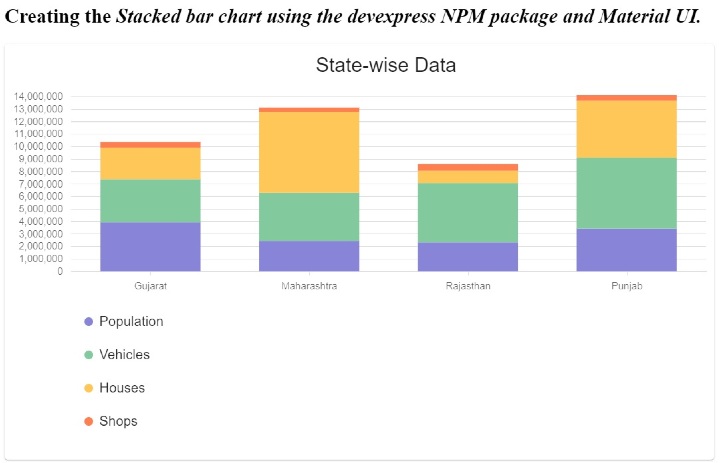
在下面的示例中,我们演示了如何创建堆积条形图。我们根据各州准备了人口、车辆、房屋和商店数据,以创建条形图。
在下面的示例中,我们演示了如何创建堆积条形图。我们根据各州准备了人口、车辆、房屋和商店数据,以创建条形图。
import React from "react";
import Paper from "@mui/material/Paper";
import {
   Chart,
   BarSeries,
   Title,
   ArgumentAxis,
   ValueAxis,
   Legend,
} from "@devexpress/dx-react-chart-material-ui";
import { Stack, Animation } from "@devexpress/dx-react-chart";

const chartData = [
   { state: "Gujarat", population: 3938223, vehicles: 3456800, houses: 2535447, shops: 454464 },
   { state: "Maharashtra", population: 2446456, vehicles: 3864500, houses: 6485534, shops: 344654 },
   { state: "Rajasthan", population: 2332543, vehicles: 4756549, houses: 981496, shops: 545621 },
   { state: "Punjab", population: 3434657, vehicles: 5686564, houses: 4569847, shops: 448734 },
];

function App() {
   return (
      <div>
         <h2>
            Creating the{" "}
            <i>
               Stacked bar chart using the devexpress NPM package and Material UI.
            </i>
         </h2>
         <Paper>
            <Chart data = {chartData}>
               <ArgumentAxis />
               <ValueAxis max = {50000000} />

               <BarSeries
                  name = "Population"
                  valueField = "population"
                  argumentField = "state"
                  color = "#8884d8"
               />
               <BarSeries
                  name = "Vehicles"
                  valueField = "vehicles"
                  argumentField = "state"
                  color = "#82ca9d"
               />
               <BarSeries
                  name = "Houses"
                  valueField = "houses"
                  argumentField = "state"
                  color = "#ffc658"
               />
               <BarSeries
                  name = "Shops"
                  valueField = "shops"
                  argumentField = "state"
                  color = "#ff7f50"
               />
               <Animation />
               <Legend position = "bottom" />
               <Title text = "State-wise Data" />
               <Stack stacks = {[{ series: ["Population", "Vehicles", "Houses", "Shops"] }]} />
            </Chart>
         </Paper>
      </div>
   );
}

export default App;
输出
我们学习了使用 Devexpress 和 Material UI 库来创建和设计图表。 Devexpress NPM 包是 Material UI 和 Devexpress 图表库之间的桥梁。此外,我们在本教程中学习了创建各种类型的条形图。
以上是如何使用 Material UI 和 Devexpress 在 React 中创建条形图?的详细内容。更多信息请关注PHP中文网其他相关文章!

热AI工具

Undresser.AI Undress
人工智能驱动的应用程序,用于创建逼真的裸体照片

AI Clothes Remover
用于从照片中去除衣服的在线人工智能工具。

Undress AI Tool
免费脱衣服图片

Clothoff.io
AI脱衣机

AI Hentai Generator
免费生成ai无尽的。

热门文章
热工具

记事本++7.3.1
好用且免费的代码编辑器

SublimeText3汉化版
中文版,非常好用

禅工作室 13.0.1
功能强大的PHP集成开发环境

Dreamweaver CS6
视觉化网页开发工具

SublimeText3 Mac版
神级代码编辑软件(SublimeText3)
热门话题


 谁得到更多的Python或JavaScript?
Apr 04, 2025 am 12:09 AM
谁得到更多的Python或JavaScript?
Apr 04, 2025 am 12:09 AM
Python和JavaScript开发者的薪资没有绝对的高低,具体取决于技能和行业需求。1.Python在数据科学和机器学习领域可能薪资更高。2.JavaScript在前端和全栈开发中需求大,薪资也可观。3.影响因素包括经验、地理位置、公司规模和特定技能。
 如何使用JavaScript将具有相同ID的数组元素合并到一个对象中?
Apr 04, 2025 pm 05:09 PM
如何使用JavaScript将具有相同ID的数组元素合并到一个对象中?
Apr 04, 2025 pm 05:09 PM
如何在JavaScript中将具有相同ID的数组元素合并到一个对象中?在处理数据时,我们常常会遇到需要将具有相同ID�...
 神秘的JavaScript:它的作用以及为什么重要
Apr 09, 2025 am 12:07 AM
神秘的JavaScript:它的作用以及为什么重要
Apr 09, 2025 am 12:07 AM
JavaScript是现代Web开发的基石,它的主要功能包括事件驱动编程、动态内容生成和异步编程。1)事件驱动编程允许网页根据用户操作动态变化。2)动态内容生成使得页面内容可以根据条件调整。3)异步编程确保用户界面不被阻塞。JavaScript广泛应用于网页交互、单页面应用和服务器端开发,极大地提升了用户体验和跨平台开发的灵活性。
 console.log输出结果差异:两次调用为何不同?
Apr 04, 2025 pm 05:12 PM
console.log输出结果差异:两次调用为何不同?
Apr 04, 2025 pm 05:12 PM
深入探讨console.log输出差异的根源本文将分析一段代码中console.log函数输出结果的差异,并解释其背后的原因。�...
 如何实现视差滚动和元素动画效果,像资生堂官网那样?
或者:
怎样才能像资生堂官网一样,实现页面滚动伴随的动画效果?
Apr 04, 2025 pm 05:36 PM
如何实现视差滚动和元素动画效果,像资生堂官网那样?
或者:
怎样才能像资生堂官网一样,实现页面滚动伴随的动画效果?
Apr 04, 2025 pm 05:36 PM
实现视差滚动和元素动画效果的探讨本文将探讨如何实现类似资生堂官网(https://www.shiseido.co.jp/sb/wonderland/)中�...
 初学者的打字稿,第2部分:基本数据类型
Mar 19, 2025 am 09:10 AM
初学者的打字稿,第2部分:基本数据类型
Mar 19, 2025 am 09:10 AM
掌握了入门级TypeScript教程后,您应该能够在支持TypeScript的IDE中编写自己的代码,并将其编译成JavaScript。本教程将深入探讨TypeScript中各种数据类型。 JavaScript拥有七种数据类型:Null、Undefined、Boolean、Number、String、Symbol(ES6引入)和Object。TypeScript在此基础上定义了更多类型,本教程将详细介绍所有这些类型。 Null数据类型 与JavaScript一样,TypeScript中的null
 PowerPoint可以运行JavaScript吗?
Apr 01, 2025 pm 05:17 PM
PowerPoint可以运行JavaScript吗?
Apr 01, 2025 pm 05:17 PM
在PowerPoint中可以运行JavaScript,通过VBA调用外部JavaScript文件或嵌入HTML文件来实现。1.使用VBA调用JavaScript文件,需启用宏并具备VBA编程知识。2.嵌入包含JavaScript的HTML文件,简单易行但受安全限制。优点包括扩展功能和灵活性,劣势涉及安全性、兼容性和复杂性,实际应用需注意安全性、兼容性、性能和用户体验。
