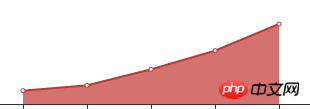
javascript - vue-echarts-v3使用的过程中折线图区域呈渐变色。
我想大声告诉你
我想大声告诉你 2017-05-16 13:36:11
0
2
1565


这是我的图表数据

我希望红色部分是渐变色。
我已经使用了visvisualMap的方法,并不能达到我想要的效果。
当我使用new echarts.graphic.LinearGradient(0, 0, 0, 1, [{

                    offset: 0,
                    color: 'rgb(255, 158, 68)'
                }, {
                    offset: 1,
                    color: 'rgb(255, 70, 131)'
                }])。。。我找到的其中一种方法,。。但是不知道怎么获取echarts对象,

由于不想在项目中引入过多的资源,所以引入zRender暂时不在考虑范围之内。。。
求助
希望解决vue-echarts-v3插件使用是,获取new echarts.graphic.LinearGradient()的办法

<IEcharts :option="bar" class="step_echarts"></IEcharts

import IEcharts from 'vue-echarts-v3'
import 'echarts/lib/chart/line'

export defalut{
data(){

return{
    bar: {
            tooltip: {},
            xAxis: {
                data: ['1泡', '2泡', '3泡', '4泡', '5泡'],
                axisTick:{
                    alignWithLabel:true
                }
            },
            yAxis: {
                show:false
            },
            series: [{
                name: 'Clouds',
                type: 'line',
                data: [5, 7, 13, 20, 30],
                areaStyle: {normal:{}}
            }]
        }
    }
}

}
}

我想大声告诉你
我想大声告诉你

全部回复(2)
世界只因有你

我随便写了三个颜色。


series: [{
        name: 'Clouds',
        type: 'line',
        data: [5, 7, 13, 20, 30],
        areaStyle: {normal:{}},
        itemStyle: {
        normal: {
            color: new echarts.graphic.LinearGradient(
                0, 0, 0, 1,
                [
                    {offset: 0, color: 'red'},
                    {offset: 0.5, color: 'pink'},
                    {offset: 1, color: '#ddd'}
                ]
            )
        }
    }
}]

过去多啦不再A梦

楼上说的对,你要想要渐变,你就要给他设置图例,告诉它从哪渐变到哪,要不然用的是默认的颜色

热门教程
更多>
最新下载
更多>
网站特效
网站源码
网站素材
前端模板
关于我们 免责声明 Sitemap
PHP中文网:公益在线PHP培训,帮助PHP学习者快速成长!