这篇文章主要介绍了关于基于python批量处理dat文件及科学计算的方法,有着一定的参考价值,现在分享给大家,有需要的朋友可以参考一下
摘要:主要介绍一些python的文件读取功能,文件内容修改,文件名后缀更改等操作。
批处理文件功能
import os
path1 = 'C:\Users\awake_ljw\Documents\python for data analysis\test1'
path2 = 'C:\Users\awake_ljw\Documents\python for data analysis\test2'
filelist = os.listdir(path1)
for files in filelist:
 Olddir = os.path.join(path1,files)
 filename = os.path.splitext(files)[0]
 filetype = os.path.splitext(files)[1]
 print Olddir
 file_test = open(Olddir,'r')
 Newdir = os.path.join(path2,str(filename)+'.csv')
 print Newdir
 file_test2 = open(Newdir,'w')
 for lines in file_test.readlines():
 strdata = ",".join(lines.split('	'))
 file_test2.write(strdata)
 file_test.close()
file_test2.close()os模块是python最基础的模块之一,一般用于文件处理等操作。上面这段代码主要就是将dat文件转化为csv文件,同时保证csv可读。一般txt文件不能通过直接改后缀改变呈csv文件格式,一般会造成文件不可读。csv文件一般通过逗号分隔文本,数据处理起来较得心应手,可以直接改后缀得到xlsx文件,一般excel也可读。
立即学习“Python免费学习笔记(深入)”;
科学计算
matlab作为一门科学计算编程语言,在科学计算的应用实在广泛,包括webread等强大的函数用起来十分顺手,但matlab是商业软件,并不免费。其实,python在科学计算效率或函数库功能包括其绘图功能、图像处理都很强大,(相比matlab,python的调色板更出色)。以下列举一些数据文件读取,绘图的一些基本操作作为参考。
数据提取及绘图
#数据提取
import os
import pandas as pd
import numpy as np
number = -1;
sudu=np.zeros(5247*5,dtype=float).reshape(5247,5)
for files in filelist1:
 number +=1
 data = pd.read_csv(str(number+1)+'a.csv')
 sudu[:,number]=data['velocity']
 x = data['x']
 y = data['y']
a = sudu[0:5184,0].reshape(81,64)
%matplotlib inline
import matplotlib.pyplot as plt
extent = [np.min(x),np.max(x),np.min(y),np.max(y)]
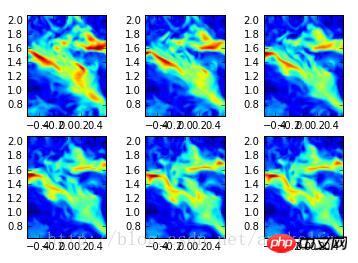
plt.subplot(231)
u0 = sudu[0:5184,0].reshape(81,64)
plt.imshow(u0,extent=extent,origin='lower')
plt.subplot(232)
u1 = sudu[0:5184,1].reshape(81,64)
plt.imshow(u1,extent=extent,origin='lower')
plt.subplot(233)
u2 = sudu[0:5184,2].reshape(81,64)
plt.imshow(u2,extent=extent,origin='lower')
plt.subplot(234)
u3 = sudu[0:5184,3].reshape(81,64)
plt.imshow(u3,extent=extent,origin='lower')
#plt.axis("equal")
plt.subplot(235)
u4 = sudu[0:5184,4].reshape(81,64)
plt.imshow(u4,extent=extent,origin='lower')
plt.subplot(236)
u5 = sudu[0:5184,4].reshape(81,64)
plt.imshow(u5,extent=extent,origin='lower')
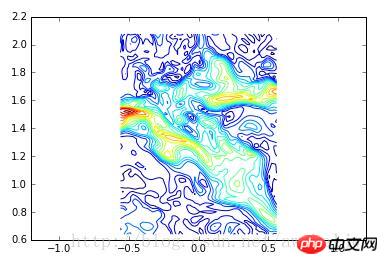
#contour
cs = plt.contour(u5, 20,extent = extent)
plt.xlim(-0.8,0.8)
plt.ylim(0.6,2.2)
plt.axis('equal')

python的科学计算功能与matlab及其相似,python有几点不同在于
1.python有元组的数据类型,元组不同于列表,元组不可更改
2.python的数据检索使用[]
总而言之,python的数据形式及其丰富。
numpy以及pandas是python用于数据处理的两个库,具体使用方法主要推荐python科学计算这本书。matplotlib用于绘图,刚也说了,其调色板很厉害哦,图像质量不错。
预告:代码运行环境均为jupyter notebook,简直神器一般的存在,网上搭建的资料也太多。
相关推荐:
以上就是基于python批量处理dat文件及科学计算的方法的详细内容,更多请关注php中文网其它相关文章!

python怎么学习?python怎么入门?python在哪学?python怎么学才快?不用担心,这里为大家提供了python速学教程(入门到精通),有需要的小伙伴保存下载就能学习啦!

Copyright 2014-2025 https://www.php.cn/ All Rights Reserved | php.cn | 湘ICP备2023035733号