
current location:Home > Technical Articles > Web Front-end
- Direction:
- All web3.0 Backend Development Web Front-end Database Operation and Maintenance Development Tools PHP Framework Daily Programming WeChat Applet Common Problem Other Tech CMS Tutorial Java System Tutorial Computer Tutorials Hardware Tutorial Mobile Tutorial Software Tutorial Mobile Game Tutorial
- Classify:


-

- How to implement multiple types of statistical charts under the Vue framework
- How to implement various types of statistical charts under the Vue framework. In modern web application development, data visualization is a crucial part. As a commonly used data visualization method, statistical charts are widely used in various types of applications. As a popular JavaScript framework, the Vue framework provides powerful tools and libraries, allowing developers to easily create various types of statistical charts. This article will introduce how to use the Vue framework to implement various types of statistical charts and provide corresponding code examples. inVu
- Vue.js . echarts 1812 2023-08-18 11:52:51
-
- Beautification and customization of Vue statistical charts
- Introduction to the beautification and customization of Vue statistical charts: In modern Internet application development, the visual display of data is a very important part. As a form of data visualization, statistical charts can help users understand and analyze data more intuitively. Vue is a progressive JavaScript framework for building interactive and reusable web interfaces. Combining Vue with some excellent chart libraries, we can quickly customize and beautify various statistical charts. This article will take echarts as an example to demonstrate how to use it in a Vue project
- Vue.js . echarts 1223 2023-08-18 09:33:05
-
- How to implement statistical charts of user behavior under the Vue framework
- How to implement statistical charts of user behavior under the Vue framework Introduction: In modern web applications, statistics and analysis of user behavior is a very important function. By counting user behavior, we can understand users' preferences and habits, thereby optimizing product design and improving user experience. This article will introduce how to use the Vue framework to implement statistical charts of user behavior. Vue framework introduction: Vue is a popular JavaScript framework for building user interfaces. It is simple and flexible
- Vue.js . echarts 1237 2023-08-18 08:17:14
-
- Selection and comparison of Vue statistical chart plug-ins
- Selection and comparison of Vue statistical chart plug-ins With the increasing demand for data visualization, statistical chart plug-ins have become an indispensable part of development. For projects developed using the Vue framework, it is very important to choose a suitable Vue statistical chart plug-in. This article will introduce some common Vue statistical chart plug-ins and compare them to help developers choose the appropriate plug-in. vue-chartjsvue-chartjs is a Vue plug-in based on Chart.js, which provides a simple
- Vue.js . echarts 1314 2023-08-17 22:01:06
-
- How to implement statistical charts for online surveys under the Vue framework
- Overview of how to implement statistical charts for online surveys under the Vue framework: With the development of the Internet, more and more questionnaires have become online forms, and the analysis and display of online survey results are crucial for decision-makers. This article will introduce how to use the Vue framework and commonly used data visualization libraries to implement the statistical chart function of online surveys. Technology stack: Vue.js: A progressive JavaScript framework for building user interfaces. ECharts: an open source visualization based on JavaScript
- Vue.js . echarts 1508 2023-08-17 21:54:29
-
- How to use Vue to implement statistical chart layout on mobile terminals
- How to use Vue to implement statistical chart layout on mobile terminals In the era of mobile Internet, data statistics and analysis have become important means for corporate decision-making and user experience improvement. Displaying statistical charts on mobile terminals is a common requirement. This article will introduce how to use the Vue framework and related chart libraries, such as Echarts or Chart.js, to implement statistical chart layout on the mobile side. 1. Build a Vue project First, we need to build a Vue project. You can choose to use VueCLI to quickly generate a basic Vu
- Vue.js . echarts 1964 2023-08-17 18:13:04
-
- PHP and Vue.js Getting Started Tutorial: How to Create a Simple Statistical Chart
- PHP and Vue.js Getting Started Tutorial: How to Create a Simple Statistical Chart Introduction: Statistical charts are a commonly used method in data visualization, which can help us understand and analyze data more intuitively. This tutorial will introduce how to use PHP and Vue.js to create simple statistical charts, and use practical examples to help readers get started. Part One: Preparation Before starting, we need to make sure that PHP and Vue.js have been installed and are familiar with their basic usage. You can check whether the installation is successful using the following command: PHP
- PHP Tutorial . echarts 1537 2023-08-17 16:38:01
-
- How to create nested statistical charts using Vue
- How to create nested statistical charts using Vue Vue.js is a popular JavaScript framework that provides a concise and efficient way to build user interfaces. When it comes to data visualization, Vue also works well with many other libraries and tools. This article will introduce how to use Vue and a popular data visualization library to create nested statistical charts. Before starting, make sure you have Vue.js installed and are familiar with the basic usage of Vue. This article will use ECharts as data visualization
- Vue.js . echarts 866 2023-08-17 13:54:14
-
- Implementation of column and line chart functions in Vue statistical charts
- Implementation of bar and line chart functions in Vue statistical charts Introduction: In data visualization applications, statistical charts are a commonly used way to display data. Vue, as a popular JavaScript framework, provides rich functions and ease of use, and is very suitable for implementing statistical charts. This article will introduce the specific steps to implement bar charts and line charts using Vue, and attach code examples. 1. Bar chart implementation A bar chart is a chart that uses the height of a rectangle to represent the size of the data. The following is using Vue and echarts library
- Vue.js . echarts 1910 2023-08-17 11:39:19
-
- How to use Vue to implement statistical charts for large-screen data display
- How to use Vue to implement statistical charts for large-screen data display. In the modern information society, data statistics and visualization have become important means of decision-making and analysis. In order to display data more intuitively, we often use statistical charts. Under the Vue framework, you can easily achieve large-screen data display needs by using some excellent chart libraries. This article will introduce how to use Vue combined with two mainstream statistical chart libraries, echarts and chart.js, to display data. First, we need to install echarts and c for the Vue project
- Vue.js . echarts 1852 2023-08-17 09:54:24
-
- Dynamic data update and display optimization of Vue statistical charts
- Dynamic data update and display optimization of Vue statistical charts Introduction: In today's data-driven era, the use of statistical charts is becoming more and more widespread. Using Vue as the front-end development framework, combined with various excellent chart libraries, you can easily implement various types of statistical charts. However, when data changes frequently and statistical charts need to be dynamically updated and displayed, we need to consider some optimization strategies to improve page performance and user experience. This article will introduce how to implement dynamic data update and display optimization of statistical charts in Vue. We will use ECh
- Vue.js . echarts 1184 2023-08-17 09:48:22
-
- How to use Vue to dynamically update statistical charts based on data
- How to use Vue to dynamically update statistical charts based on data. Statistical charts play an important role in data visualization. They can display data changes and trends in an intuitive and clear way, helping users better understand and analyze data. As a popular JavaScript framework, Vue provides a wealth of tools and lifecycle hooks to handle data changes and view updates. This article will introduce how to use Vue to dynamically update statistical charts based on data, and provide corresponding code examples. Preparation First, make sure that V has been introduced
- Vue.js . echarts 1441 2023-08-17 08:24:32
-
- How to use Vue form processing to implement form statistics and reporting functions
- How to use Vue form processing to implement form statistics and reporting functions Introduction: With the advancement of informatization, forms have become an indispensable part of various business scenarios. The statistics and reporting functions of the form are indispensable tools in data analysis and decision-making. This article will introduce how to use Vue form processing to implement form statistics and reporting functions, and provide code examples for readers' reference. 1. Set up a Vue development environment. First, we need to set up a Vue development environment. We can use VueCLI to quickly build a Vu
- Vue.js . echarts 2042 2023-08-10 23:48:15
-
- What is ECharts
- ECharts is an open source visualization library based on JavaScript, which can help developers easily achieve various complex data visualization effects. It provides a wealth of chart types and interactive functions. It also has strong customization, mobile adaptability, community support, etc. Advantages, whether in business applications, data analysis or data display, ECharts is a highly recommended tool.
- Common Problem . echarts 2633 2023-08-04 10:24:05
-
- Quick Start: Use Go language functions to implement simple data visualization chart display
- Quick Start: Use Go language functions to implement simple data visualization chart display. As a powerful and concise programming language, Go (also known as Golang) has rapidly become popular in recent years. Its fast compilation, efficient execution, and concise syntax make Go one of the preferred languages for many developers. This article will introduce how to use Go language functions to implement simple data visualization chart display, allowing you to get started quickly. First, we need to install the Go language development environment. You can download it from the official website (https://go
- Golang . echarts 1235 2023-07-31 22:49:08


Recommended Articles

Tool Recommendations
jQuery enterprise message form contact code
jQuery enterprise message form contact code is a simple and practical enterprise message form and contact us introduction page code.
form button
2024-02-29

HTML5 MP3 music box playback effects
HTML5 MP3 music box playback special effect is an mp3 music player based on HTML5 css3 to create cute music box emoticons and click the switch button.
Player special effects
2024-02-29

HTML5 cool particle animation navigation menu special effects
HTML5 cool particle animation navigation menu special effect is a special effect that changes color when the navigation menu is hovered by the mouse.
Menu navigation
2024-02-29
jQuery visual form drag and drop editing code
jQuery visual form drag and drop editing code is a visual form based on jQuery and bootstrap framework.
form button
2024-02-29

Organic fruit and vegetable supplier web template Bootstrap5
An organic fruit and vegetable supplier web template-Bootstrap5
Bootstrap template
2023-02-03
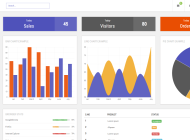
Bootstrap3 multifunctional data information background management responsive web page template-Novus
Bootstrap3 multifunctional data information background management responsive web page template-Novus
backend template
2023-02-02

Real estate resource service platform web page template Bootstrap5
Real estate resource service platform web page template Bootstrap5
Bootstrap template
2023-02-02

Simple resume information web template Bootstrap4
Simple resume information web template Bootstrap4
Bootstrap template
2023-02-02

Cute summer elements vector material (EPS PNG)
This is a cute summer element vector material, including the sun, sun hat, coconut tree, bikini, airplane, watermelon, ice cream, ice cream, cold drink, swimming ring, flip-flops, pineapple, conch, shell, starfish, crab, Lemons, sunscreen, sunglasses, etc., the materials are provided in EPS and PNG formats, including JPG previews.
PNG material
2024-05-09

Four red 2023 graduation badges vector material (AI EPS PNG)
This is a red 2023 graduation badge vector material, four in total, available in AI, EPS and PNG formats, including JPG preview.
PNG material
2024-02-29

Singing bird and cart filled with flowers design spring banner vector material (AI EPS)
This is a spring banner vector material designed with singing birds and a cart full of flowers. It is available in AI and EPS formats, including JPG preview.
banner picture
2024-02-29

Golden graduation cap vector material (EPS PNG)
This is a golden graduation cap vector material, available in EPS and PNG formats, including JPG preview.
PNG material
2024-02-27

Home Decor Cleaning and Repair Service Company Website Template
Home Decoration Cleaning and Maintenance Service Company Website Template is a website template download suitable for promotional websites that provide home decoration, cleaning, maintenance and other service organizations. Tip: This template calls the Google font library, and the page may open slowly.
Front-end template
2024-05-09

Fresh color personal resume guide page template
Fresh color matching personal job application resume guide page template is a personal job search resume work display guide page web template download suitable for fresh color matching style. Tip: This template calls the Google font library, and the page may open slowly.
Front-end template
2024-02-29
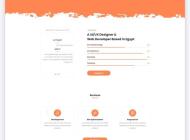
Designer Creative Job Resume Web Template
Designer Creative Job Resume Web Template is a downloadable web template for personal job resume display suitable for various designer positions. Tip: This template calls the Google font library, and the page may open slowly.
Front-end template
2024-02-28

Modern engineering construction company website template
The modern engineering and construction company website template is a downloadable website template suitable for promotion of the engineering and construction service industry. Tip: This template calls the Google font library, and the page may open slowly.
Front-end template
2024-02-28

