
current location:Home > Technical Articles > Web Front-end
- Direction:
- All web3.0 Backend Development Web Front-end Database Operation and Maintenance Development Tools PHP Framework Common Problem Other Tech CMS Tutorial Java System Tutorial Computer Tutorials Hardware Tutorial Mobile Tutorial Software Tutorial Mobile Game Tutorial
- Classify:


-

- How to dynamically adjust the yAxis.nameGap and left offset of the echarts chart based on yAxis data?
- How to dynamically adjust the yAxis.nameGap and left offset of the echarts chart based on yAxis data? When drawing charts using echarts, you often encounter the name of yAxis...
- JS Tutorial . echarts 365 2025-04-04 17:45:01
-
- How to accurately display the calculation results of ECharts histogram floating point numbers?
- Detailed explanation of ECharts Histogram Floating Point Number Precision Control When drawing histograms using ECharts, you often encounter the problem of floating point number calculation accuracy. For example, from the backend...
- JS Tutorial . echarts 273 2025-04-04 16:21:01
-
- How to draw an annual chart showing daily values with ECharts?
- Drawing an annual chart containing daily values Many data visualization tasks require presenting the daily data in a clear and understandable way. This article will discuss how...
- JS Tutorial . echarts 794 2025-04-04 16:18:01
-
- How to achieve synchronous sliding effect of rich text with DataZoom in ECharts?
- Discussion on the problem of synchronous sliding of rich text and DataZoom in ECharts. When using ECharts for data visualization, we often encounter some specific needs, such as...
- JS Tutorial . echarts 1041 2025-04-04 14:12:01
-
- How to make rich text in Echarts change as dataZoom slides?
- How to make rich text in Echarts change as dataZoom slides? When using Echarts for data visualization, you often need to add rich text to the chart...
- JS Tutorial . echarts 959 2025-04-04 13:36:02
-
- Django Echarts scatter plot data is missing: How to dynamically adjust the axis range to solve the data point display problem?
- Django...
- Python Tutorial . echarts 756 2025-04-01 19:00:02
-
- How can Echarts implement line chart data grouping as conveniently as Plotly Express?
- This article compares Echarts and Plotly Express for creating grouped line charts. While Plotly Express offers intuitive grouping, Echarts requires manual data preprocessing. The article details methods for efficiently structuring data for Echarts,
- Python Tutorial . echarts 1028 2025-03-03 17:04:40
-
- Apache Log Parser and Data Normalization Application
- Python and MySQL work together to process Apache logs. ApacheLogs2MySQL is an automated tool that contains two Python modules and a MySQL schema. It is used to automatically import access and error log files and normalize the data into the database to facilitate report generation and data analysis. The tool supports Windows, Linux and MacOS systems and has been tested on MySQL versions 8.0.39, 8.4.3, 9.0.0 and 9.1.0. A single PythonProcessLogs function execution can handle 4 log formats and 2 error log formats, as well as 5 MySQL stored procedures. The database system is designed to accommodate
- Mysql Tutorial . echarts 502 2025-01-10 12:31:42
-
- JavaScript Programming Tutorials: Enhance Your Skills with LabEx
- Dive into the world of JavaScript with LabEx's captivating programming tutorials! Whether you're a beginner or an experienced developer, these hands-on projects will help you expand your coding prowess and tackle real-world challenges. ?
- JS Tutorial . echarts 1169 2024-09-19 04:17:06
-
- JavaScript Programming Tutorials: From URL Shortener to Deep Array Flattening
- Are you a budding JavaScript enthusiast looking to expand your skills? Look no further! We've curated a collection of 5 captivating programming tutorials from LabEx, each designed to take your JavaScript prowess to new heights. ? 1. Build
- JS Tutorial . echarts 950 2024-09-12 10:33:31
-
- JavaScript Programming Tutorials: From URL Shortener to Deep Array Flattening
- Are you a budding JavaScript enthusiast looking to expand your skills? Look no further! We've curated a collection of 5 captivating programming tutorials from LabEx, each designed to take your JavaScript prowess to new heights. ? 1. Build
- JS Tutorial . echarts 616 2024-09-12 10:33:30
-
- How CheckStat was created: Real-time site analytics
- What is CheckStat CheckStat is a project I developed to help website owners, developers, and analysts better understand what's happening on their web resources. This tool lets you track what your visitors are doing on your site in real-time. An
- PHP Tutorial . echarts 715 2024-08-26 22:30:32
-
- How to align echarts map textures
- This article provides guidance on aligning textures on echarts maps. The main issue addressed is ensuring that textures are properly aligned with the map features. Two alignment techniques are discussed: manual alignment and automatic alignment using
- Common Problem . echarts 694 2024-08-15 15:55:16
-
- How to modify the position of country name display in echart map js file
- This guide explains how to modify the appearance and positioning of country names in ECharts map visualizations using JavaScript. It covers adjusting the position inside or outside countries, changing the font size and color, and controlling the hori
- JS Tutorial . echarts 1354 2024-08-15 15:31:21
-
- Usage of echarts map
- This article provides a comprehensive guide to using ECharts for interactive map visualization. It covers importing data, configuring map settings, and adding visual elements and interactions. Additionally, it explores techniques for visualizing geog
- Front-end Q&A . echarts 845 2024-08-15 12:25:18


Tool Recommendations

jQuery enterprise message form contact code
jQuery enterprise message form contact code is a simple and practical enterprise message form and contact us introduction page code.
form button
2024-02-29

HTML5 MP3 music box playback effects
HTML5 MP3 music box playback special effect is an mp3 music player based on HTML5 css3 to create cute music box emoticons and click the switch button.
Player special effects
2024-02-29

HTML5 cool particle animation navigation menu special effects
HTML5 cool particle animation navigation menu special effect is a special effect that changes color when the navigation menu is hovered by the mouse.
Menu navigation
2024-02-29
jQuery visual form drag and drop editing code
jQuery visual form drag and drop editing code is a visual form based on jQuery and bootstrap framework.
form button
2024-02-29

Organic fruit and vegetable supplier web template Bootstrap5
An organic fruit and vegetable supplier web template-Bootstrap5
Bootstrap template
2023-02-03
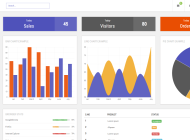
Bootstrap3 multifunctional data information background management responsive web page template-Novus
Bootstrap3 multifunctional data information background management responsive web page template-Novus
backend template
2023-02-02

Real estate resource service platform web page template Bootstrap5
Real estate resource service platform web page template Bootstrap5
Bootstrap template
2023-02-02

Simple resume information web template Bootstrap4
Simple resume information web template Bootstrap4
Bootstrap template
2023-02-02

Cute summer elements vector material (EPS PNG)
This is a cute summer element vector material, including the sun, sun hat, coconut tree, bikini, airplane, watermelon, ice cream, ice cream, cold drink, swimming ring, flip-flops, pineapple, conch, shell, starfish, crab, Lemons, sunscreen, sunglasses, etc., the materials are provided in EPS and PNG formats, including JPG previews.
PNG material
2024-05-09

Four red 2023 graduation badges vector material (AI EPS PNG)
This is a red 2023 graduation badge vector material, four in total, available in AI, EPS and PNG formats, including JPG preview.
PNG material
2024-02-29

Singing bird and cart filled with flowers design spring banner vector material (AI EPS)
This is a spring banner vector material designed with singing birds and a cart full of flowers. It is available in AI and EPS formats, including JPG preview.
banner picture
2024-02-29

Golden graduation cap vector material (EPS PNG)
This is a golden graduation cap vector material, available in EPS and PNG formats, including JPG preview.
PNG material
2024-02-27

Home Decor Cleaning and Repair Service Company Website Template
Home Decoration Cleaning and Maintenance Service Company Website Template is a website template download suitable for promotional websites that provide home decoration, cleaning, maintenance and other service organizations. Tip: This template calls the Google font library, and the page may open slowly.
Front-end template
2024-05-09

Fresh color personal resume guide page template
Fresh color matching personal job application resume guide page template is a personal job search resume work display guide page web template download suitable for fresh color matching style. Tip: This template calls the Google font library, and the page may open slowly.
Front-end template
2024-02-29
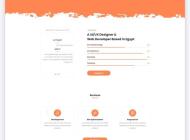
Designer Creative Job Resume Web Template
Designer Creative Job Resume Web Template is a downloadable web template for personal job resume display suitable for various designer positions. Tip: This template calls the Google font library, and the page may open slowly.
Front-end template
2024-02-28

Modern engineering construction company website template
The modern engineering and construction company website template is a downloadable website template suitable for promotion of the engineering and construction service industry. Tip: This template calls the Google font library, and the page may open slowly.
Front-end template
2024-02-28

