
current location:Home > Technical Articles > Web Front-end
- Direction:
- All web3.0 Backend Development Web Front-end Database Operation and Maintenance Development Tools PHP Framework Daily Programming WeChat Applet Common Problem Other Tech CMS Tutorial Java System Tutorial Computer Tutorials Hardware Tutorial Mobile Tutorial Software Tutorial Mobile Game Tutorial
- Classify:


-

- How to draw a bubble chart using ECharts in Python
- How to use ECharts to draw bubble charts in Python ECharts is a data visualization library based on JavaScript. It provides a variety of chart types, including bar charts, line charts, pie charts, etc. In ECharts, bubble chart is a commonly used chart type, which can show the distribution of data through dots of different sizes. This article will introduce in detail how to use ECharts to draw bubble charts in Python and provide specific code examples. Step 1: Install necessary libraries and
- Python Tutorial . echarts 1790 2023-12-17 19:17:59
-

- How to draw a funnel chart using ECharts and Python interface
- Method of drawing funnel chart using ECharts and Python interface In data visualization, funnel chart (FunnelChart) is widely used to describe the quantitative changes between different stages or parts in a process. The funnel chart can clearly represent the quantitative differences and conversion rates between each stage, helping us better understand the trends and patterns behind the data. In this article, we will introduce how to use ECharts and Python interfaces to draw funnel charts, and give specific code examples. first
- Python Tutorial . echarts 759 2023-12-17 19:06:45
-

- How to use php interface and ECharts to realize data visualization statistical chart
- Introduction to how to use PHP interface and ECharts to implement data visualization charts. In web applications, data visualization charts are very important for displaying and analyzing large amounts of data. This article will introduce how to use the PHP interface and ECharts library to implement data visualization statistical charts, and provide readers with specific code examples. Prerequisites Before starting, we need to ensure that the following prerequisites are met: The PHP runtime environment is installed. A database is built on the server to store data and has readable data tables.
- PHP Tutorial . echarts 753 2023-12-17 18:02:01
-

- How to use ECharts and Java interface to implement chart linkage statistical analysis
- How to use ECharts and Java interfaces to implement chart linkage statistical analysis ECharts is a JavaScript-based visual chart library that can help us easily create a variety of charts, such as line charts, bar charts, pie charts, etc. Java is a very popular programming language that is widely used in enterprise applications. In this article, we will introduce how to use ECharts and Java interfaces to implement chart linkage statistical analysis. 1. Prerequisite knowledge Before studying this article, you need to
- javaTutorial . echarts 698 2023-12-17 17:50:20
-

- How to use php interface and ECharts to implement data filtering and filtering of statistical charts
- How to use the PHP interface and ECharts to implement data screening and filtering of statistical charts requires specific code examples. In data visualization, using statistical charts is a common way to display data. In practical applications, data often needs to be screened and filtered to meet different needs. The PHP interface and ECharts are two widely used tools through which data filtering and filtering of statistical charts can be implemented. The following will use an example to demonstrate how to use the PHP interface and ECharts implementation
- PHP Tutorial . echarts 837 2023-12-17 17:40:01
-

- How to use ECharts and php interface to implement data caching and updating of statistical charts
- How to use ECharts and php interfaces to implement data caching and updating of statistical charts. In web applications, statistical charts are often used to display data analysis results. ECharts is a popular open source JavaScript charting library that can help us create various types of interactive statistical charts. However, fetching data directly from the database and rendering charts may cause performance issues when the amount of data is very large or the data is updated frequently. In order to solve this problem, we can use the php interface to implement statistical charts
- PHP Tutorial . echarts 781 2023-12-17 17:38:02
-

- How to generate stacked area plots using ECharts and Python interface
- How to generate stacked area charts using ECharts and Python interface ECharts is an open source visualization library based on JavaScript that can help us create interactive and beautiful charts. Using ECharts' Python interface, we can use Python code to generate various types of charts, including stacked area charts. This article will introduce how to use ECharts and Python interfaces to generate stacked area charts, and give specific code examples. Preparations First,
- Python Tutorial . echarts 790 2023-12-17 17:12:56
-

- ECharts and golang practical guide: tutorial on making diverse statistical charts
- ECharts and Golang Practical Guide: Tutorial on making diverse statistical charts, requiring specific code examples. As a leader in the field of data visualization, ECharts is irreplaceable in many scenarios. As a programming language with powerful performance, golang also has certain advantages in big data scenarios. This article will introduce how to use ECharts and golang to create diverse statistical charts, and provide specific code examples. Before starting the preparation work, you need to master the following basic skills: go
- Golang . echarts 607 2023-12-17 17:10:20
-

- How to combine the PHP interface and ECharts to display large data statistical charts
- How to combine PHP interface and ECharts to realize the display of large data volume statistical charts. Introduction: With the rapid development of the Internet and the promotion of intelligence, the growth of data volume has shown an explosive growth trend. For statistics of large amounts of data, traditional data display methods can no longer meet the needs. ECharts is an open source visualization library based on JavaScript, which provides a variety of chart types and powerful data display functions. This article aims to introduce how to combine the PHP interface and EChar
- PHP Tutorial . echarts 1369 2023-12-17 16:42:01
-

- JavaScript and WebSockets: Building high-performance, real-time data visualizations
- JavaScript and WebSocket: Creating high-performance real-time data visualization With the rapid development of the Internet, real-time data visualization is becoming more and more important in many fields. Whether it is financial transactions, logistics and transportation, or industrial monitoring and other fields, the visualization of real-time data can help us better understand and analyze the data and make more informed decisions. In web development, JavaScript and WebSocket technologies are combined to achieve high-performance real-time data visualization. W
- JS Tutorial . echarts 1292 2023-12-17 16:38:30
-

- ECharts and Java interface: how to apply statistical analysis in the field of intelligent manufacturing
- ECharts and Java interface: How to apply statistical analysis in the field of intelligent manufacturing, specific code examples are required. Intelligent manufacturing is an important development direction of today's manufacturing industry. It uses advanced technology and information technology to improve production efficiency, quality and flexibility. Statistical analysis is an indispensable part of intelligent manufacturing, which can help companies monitor and optimize the production process. This article will introduce how to use ECharts and Java interfaces to perform statistical analysis in the field of intelligent manufacturing, and give specific code examples. ECha
- javaTutorial . echarts 1035 2023-12-17 16:38:21
-

- How to display real-time statistical charts through ECharts and php interfaces
- How to display real-time statistical charts through ECharts and PHP interfaces. With the rapid development of the Internet and big data technology, data visualization has become an important part. As an excellent open source JavaScript data visualization library, ECharts can help us display various statistical charts simply and efficiently. This article will introduce how to display real-time statistical charts through ECharts and PHP interfaces, and provide relevant code examples. 1. Preparation Before starting, we need to do some preparations
- PHP Tutorial . echarts 1168 2023-12-17 16:38:02
-

- How to draw scatter plots using ECharts and Python interface
- How to draw scatter plots using ECharts and Python interfaces ECharts is an excellent open source visualization library, developed based on JavaScript language. Through simple configuration, various chart drawing and interactive effects can be achieved. Python is a powerful programming language with a rich data processing and visualization toolkit, which provides a lot of convenience for data analysis and visualization. This article will introduce how to use ECharts and Python interfaces to draw scatter plots, and give specific codes.
- Python Tutorial . echarts 866 2023-12-17 16:06:54
-

- ECharts scatter plot (multidimensional): how to display data relationships and distribution
- ECharts Scatter Chart (Multi-dimensional): How to display data relationships and distribution, specific code examples are required. Introduction: In the field of data visualization, scatter chart is a commonly used chart type, which can display the relationship between different dimensions and the distribution of data. Distribution. As a powerful and flexible visualization library, ECharts provides a wealth of functions and configuration options that can be used to create various types of scatter plots. This article will introduce how to use ECharts to create scatter plots and give specific code examples. Prepare the data: First,
- JS Tutorial . echarts 853 2023-12-17 16:06:40
-

- ECharts and golang: Tips and experience sharing on making practical statistical charts
- ECharts and golang: Sharing skills and experience in making practical statistical charts Introduction: In today's era of information explosion, data has become an important basis for decision-making and development in various industries. As the main tool for data visualization, statistical charts can help us better understand and analyze data. This article will introduce how to use ECharts and golang to create practical statistical charts, and share some practical tips and experiences. 1. Introduction to ECharts ECharts is a powerful JavaScript open source by Baidu.
- Golang . echarts 719 2023-12-17 15:58:30

Tool Recommendations

jQuery enterprise message form contact code
jQuery enterprise message form contact code is a simple and practical enterprise message form and contact us introduction page code.
form button
2024-02-29

HTML5 MP3 music box playback effects
HTML5 MP3 music box playback special effect is an mp3 music player based on HTML5 css3 to create cute music box emoticons and click the switch button.
Player special effects
2024-02-29

HTML5 cool particle animation navigation menu special effects
HTML5 cool particle animation navigation menu special effect is a special effect that changes color when the navigation menu is hovered by the mouse.
Menu navigation
2024-02-29
jQuery visual form drag and drop editing code
jQuery visual form drag and drop editing code is a visual form based on jQuery and bootstrap framework.
form button
2024-02-29

Organic fruit and vegetable supplier web template Bootstrap5
An organic fruit and vegetable supplier web template-Bootstrap5
Bootstrap template
2023-02-03
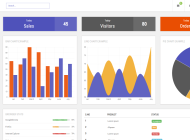
Bootstrap3 multifunctional data information background management responsive web page template-Novus
Bootstrap3 multifunctional data information background management responsive web page template-Novus
backend template
2023-02-02

Real estate resource service platform web page template Bootstrap5
Real estate resource service platform web page template Bootstrap5
Bootstrap template
2023-02-02

Simple resume information web template Bootstrap4
Simple resume information web template Bootstrap4
Bootstrap template
2023-02-02

Cute summer elements vector material (EPS PNG)
This is a cute summer element vector material, including the sun, sun hat, coconut tree, bikini, airplane, watermelon, ice cream, ice cream, cold drink, swimming ring, flip-flops, pineapple, conch, shell, starfish, crab, Lemons, sunscreen, sunglasses, etc., the materials are provided in EPS and PNG formats, including JPG previews.
PNG material
2024-05-09

Four red 2023 graduation badges vector material (AI EPS PNG)
This is a red 2023 graduation badge vector material, four in total, available in AI, EPS and PNG formats, including JPG preview.
PNG material
2024-02-29

Singing bird and cart filled with flowers design spring banner vector material (AI EPS)
This is a spring banner vector material designed with singing birds and a cart full of flowers. It is available in AI and EPS formats, including JPG preview.
banner picture
2024-02-29

Golden graduation cap vector material (EPS PNG)
This is a golden graduation cap vector material, available in EPS and PNG formats, including JPG preview.
PNG material
2024-02-27

Home Decor Cleaning and Repair Service Company Website Template
Home Decoration Cleaning and Maintenance Service Company Website Template is a website template download suitable for promotional websites that provide home decoration, cleaning, maintenance and other service organizations. Tip: This template calls the Google font library, and the page may open slowly.
Front-end template
2024-05-09

Fresh color personal resume guide page template
Fresh color matching personal job application resume guide page template is a personal job search resume work display guide page web template download suitable for fresh color matching style. Tip: This template calls the Google font library, and the page may open slowly.
Front-end template
2024-02-29
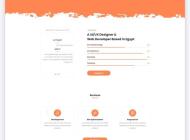
Designer Creative Job Resume Web Template
Designer Creative Job Resume Web Template is a downloadable web template for personal job resume display suitable for various designer positions. Tip: This template calls the Google font library, and the page may open slowly.
Front-end template
2024-02-28

Modern engineering construction company website template
The modern engineering and construction company website template is a downloadable website template suitable for promotion of the engineering and construction service industry. Tip: This template calls the Google font library, and the page may open slowly.
Front-end template
2024-02-28

