
current location:Home > Technical Articles > Web Front-end
- Direction:
- All web3.0 Backend Development Web Front-end Database Operation and Maintenance Development Tools PHP Framework Daily Programming WeChat Applet Common Problem Other Tech CMS Tutorial Java System Tutorial Computer Tutorials Hardware Tutorial Mobile Tutorial Software Tutorial Mobile Game Tutorial
- Classify:


-

- How to implement chart linkage in ECharts
- How to implement chart linkage in ECharts requires specific code examples. When we need to display multiple related data, displaying the data in the form of charts is an intuitive and effective way. In practical applications, we often encounter situations where multiple charts of different types need to be displayed in conjunction. As a powerful data visualization library, ECharts provides chart linkage functions, which can help us quickly realize this requirement. The way to achieve chart linkage in ECharts is through event triggering and data
- JS Tutorial . echarts 1658 2023-12-18 12:58:25
-

- Use ECharts and Java interfaces to optimize large-scale statistical charts
- Title: Optimization of large data volume statistical charts using ECharts and Java interfaces Abstract: In the era of big data, the rapid growth of data volume has put forward higher requirements for data visualization. This article introduces how to use ECharts and Java interfaces to optimize large-volume statistical charts, and improve chart performance and user experience by optimizing the data loading and processing process. The article will explain in detail the processing of data, the configuration of ECharts and the use of Java interfaces, and provide code examples for
- javaTutorial . echarts 1583 2023-12-18 12:58:10
-

- How to use ECharts and php interface to implement various types of statistical charts
- How to use ECharts and PHP interfaces to implement various types of statistical charts. ECharts is a powerful open source data visualization library. It provides a rich variety of statistical chart types and flexible configuration options, which can help us easily present data analysis results. At the same time, PHP, as a popular server-side programming language, can be seamlessly integrated with ECharts to provide a data interface for the front-end. This article will introduce how to use ECharts and PHP interfaces to implement various types of statistical charts, and give specific codes.
- PHP Tutorial . echarts 1166 2023-12-18 13:00:02
-

- How to combine ECharts and php interface to realize the export and sharing functions of statistical charts
- How to combine ECharts and PHP interfaces to realize the export and sharing functions of statistical charts. Introduction: ECharts is an open source chart library based on JavaScript. It is powerful and can easily display various statistical charts. Combined with the PHP interface, we can realize the export and sharing functions of statistical charts, making the statistical data more intuitive and easy to understand. 1. Preparation to install ECharts: Download the latest version of ECharts and introduce it into the project. It can be found on the official website (echarts.
- PHP Tutorial . echarts 1000 2023-12-18 12:56:01
-

- Implement cross-platform statistical chart design using ECharts and Java interfaces
- Implementing cross-platform statistical chart design using ECharts and Java interfaces As the importance of data analysis and visualization attracts more and more attention, statistical chart design has become an indispensable part of many software projects. When designing and implementing statistical charts, ECharts and Java interfaces are two very powerful and widely used tools that can help us achieve cross-platform statistical chart design. ECharts is a JavaScript-based open source visualization library that provides a rich range of chart types and interactions.
- javaTutorial . echarts 1021 2023-12-18 12:52:39
-

- ECharts histogram (multidimensional): how to display data grouping and comparison
- ECharts histogram (multidimensional): How to display data grouping and comparison requires specific code examples. ECharts is an open source visualization library based on JavaScript, used to display various types of data charts. The histogram is a common data visualization method that can be used to display the grouping and comparison of data in different groups or categories. This article will introduce in detail how to use the multi-dimensional histogram function of ECharts to display data grouping and comparison, and provide specific code examples for readers' reference. 1. EChar
- JS Tutorial . echarts 2105 2023-12-18 12:52:27
-

- ECharts and golang in action: Tutorial on making beautiful statistical charts
- ECharts and golang in action: Tutorial on making beautiful statistical charts Introduction Data visualization is an indispensable part of modern web applications. ECharts is a powerful and flexible open source charting library, while golang is a powerful and fast programming language. Combining the two can achieve beautiful statistical chart effects in web applications. This article will introduce you to how to use ECharts and golang to create beautiful statistical charts, and provide specific code examples. 1. Preparation work
- Golang . echarts 1356 2023-12-18 12:52:17
-

- How to generate adaptive statistical charts through the php interface and ECharts
- How to generate adaptive statistical charts through the PHP interface and ECharts. With the rapid development of the Internet and the advent of the big data era, data visualization has become one of the important ways for us to obtain and display data. As an excellent data visualization library, ECharts has become one of the tools of choice for many developers. This article will introduce how to generate adaptive statistical charts through the PHP interface and ECharts, and provide specific code examples. Confirm the project environment. First, make sure that p has been installed in your project environment.
- PHP Tutorial . echarts 720 2023-12-18 12:50:02
-

- How to use ECharts and golang to create professional-level statistical charts
- How to use ECharts and golang to create professional-level statistical charts. Introduction: In the field of data visualization, statistical charts are a very important tool. They can present complex data to users in an intuitive way, helping users better understand and analyze the data. ECharts is a very popular data visualization library, and golang is a fast and efficient programming language. This article will introduce how to use ECharts and golang to create professional-level statistical charts, and provide specific code examples. one,
- Golang . echarts 845 2023-12-18 12:49:12
-

- How to use ECharts and php interface to implement data-driven updates of statistical charts
- How to use ECharts and PHP interfaces to implement data-driven updates of statistical charts Introduction: In the development of data visualization, ECharts is a very powerful front-end chart library, while PHP is a programming language widely used in back-end development. Combining these two, we can easily implement data-driven updates of statistical charts. This article will introduce how to use ECharts and PHP interfaces to implement dynamic data updates of statistical charts, and give corresponding code examples. 1. ECharts
- PHP Tutorial . echarts 1061 2023-12-18 11:42:02
-

- How to use php interface and ECharts to generate visual statistical charts
- In today's context where data visualization is becoming more and more important, many developers hope to use various tools to quickly generate various charts and reports so that they can better display data and help decision-makers make quick judgments. In this context, using the Php interface and ECharts library can help many developers quickly generate visual statistical charts. This article will introduce in detail how to use the Php interface and ECharts library to generate visual statistical charts. In the specific implementation, we will use MySQL
- PHP Tutorial . echarts 1386 2023-12-18 11:40:02
-

- Implement adaptive responsive statistical chart design using ECharts and Java interfaces
- Using ECharts and Java interfaces to implement adaptive responsive statistical chart design. In the field of modern data visualization, the design and display of statistical charts is a very important part. In web applications, we often need to use some open source tools to help us implement such functions. ECharts is a very popular open source charting library that provides a wealth of chart types and various custom configuration options. This article will introduce how to use ECharts and Java interfaces to implement adaptive responsive statistical charts.
- javaTutorial . echarts 1468 2023-12-18 11:18:59
-

- How to combine ECharts and php interface to realize statistical chart display of multi-dimensional data
- How to combine ECharts and php interface to realize statistical chart display of multi-dimensional data Abstract: ECharts is a data visualization chart library open sourced by Baidu, which can support multiple chart types and interactive operations. Combining ECharts and php interfaces, you can easily realize statistical chart display of multi-dimensional data. This article will introduce how to use ECharts to draw different types of charts and use the PHP interface to pass data to the front end. Keywords: ECharts, php interface, more
- PHP Tutorial . echarts 1007 2023-12-18 11:06:02
-

- How to combine ECharts and php interface to realize multi-chart linkage statistical chart display
- In the field of data visualization, ECharts is a widely used front-end chart library, and its powerful data visualization functions are sought after by various industries. In actual projects, we often encounter situations where multiple charts need to be displayed in a linked manner. This article will introduce how to combine ECharts and PHP interfaces to realize the linked statistical chart display of multiple charts, and give specific code examples. 1. Pre-requisite skills In the practice of this article, you need to master the following skills: basic knowledge of HTML, CSS, and JavaScript;
- PHP Tutorial . echarts 689 2023-12-18 10:10:02
-

- How to combine ECharts and php interface to realize multi-chart linkage statistical chart display
- In the field of data visualization, ECharts is a widely used front-end chart library, and its powerful data visualization functions are sought after by various industries. In actual projects, we often encounter situations where multiple charts need to be displayed in a linked manner. This article will introduce how to combine ECharts and PHP interfaces to realize the linked statistical chart display of multiple charts, and give specific code examples. 1. Pre-requisite skills In the practice of this article, you need to master the following skills: basic knowledge of HTML, CSS, and JavaScript;
- PHP Tutorial . echarts 955 2023-12-18 10:08:02
Recommended Articles

Tool Recommendations

jQuery enterprise message form contact code
jQuery enterprise message form contact code is a simple and practical enterprise message form and contact us introduction page code.
form button
2024-02-29

HTML5 MP3 music box playback effects
HTML5 MP3 music box playback special effect is an mp3 music player based on HTML5 css3 to create cute music box emoticons and click the switch button.
Player special effects
2024-02-29

HTML5 cool particle animation navigation menu special effects
HTML5 cool particle animation navigation menu special effect is a special effect that changes color when the navigation menu is hovered by the mouse.
Menu navigation
2024-02-29
jQuery visual form drag and drop editing code
jQuery visual form drag and drop editing code is a visual form based on jQuery and bootstrap framework.
form button
2024-02-29

Organic fruit and vegetable supplier web template Bootstrap5
An organic fruit and vegetable supplier web template-Bootstrap5
Bootstrap template
2023-02-03
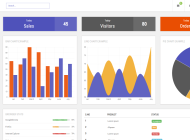
Bootstrap3 multifunctional data information background management responsive web page template-Novus
Bootstrap3 multifunctional data information background management responsive web page template-Novus
backend template
2023-02-02

Real estate resource service platform web page template Bootstrap5
Real estate resource service platform web page template Bootstrap5
Bootstrap template
2023-02-02

Simple resume information web template Bootstrap4
Simple resume information web template Bootstrap4
Bootstrap template
2023-02-02

Cute summer elements vector material (EPS PNG)
This is a cute summer element vector material, including the sun, sun hat, coconut tree, bikini, airplane, watermelon, ice cream, ice cream, cold drink, swimming ring, flip-flops, pineapple, conch, shell, starfish, crab, Lemons, sunscreen, sunglasses, etc., the materials are provided in EPS and PNG formats, including JPG previews.
PNG material
2024-05-09

Four red 2023 graduation badges vector material (AI EPS PNG)
This is a red 2023 graduation badge vector material, four in total, available in AI, EPS and PNG formats, including JPG preview.
PNG material
2024-02-29

Singing bird and cart filled with flowers design spring banner vector material (AI EPS)
This is a spring banner vector material designed with singing birds and a cart full of flowers. It is available in AI and EPS formats, including JPG preview.
banner picture
2024-02-29

Golden graduation cap vector material (EPS PNG)
This is a golden graduation cap vector material, available in EPS and PNG formats, including JPG preview.
PNG material
2024-02-27

Home Decor Cleaning and Repair Service Company Website Template
Home Decoration Cleaning and Maintenance Service Company Website Template is a website template download suitable for promotional websites that provide home decoration, cleaning, maintenance and other service organizations. Tip: This template calls the Google font library, and the page may open slowly.
Front-end template
2024-05-09

Fresh color personal resume guide page template
Fresh color matching personal job application resume guide page template is a personal job search resume work display guide page web template download suitable for fresh color matching style. Tip: This template calls the Google font library, and the page may open slowly.
Front-end template
2024-02-29
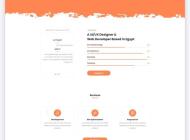
Designer Creative Job Resume Web Template
Designer Creative Job Resume Web Template is a downloadable web template for personal job resume display suitable for various designer positions. Tip: This template calls the Google font library, and the page may open slowly.
Front-end template
2024-02-28

Modern engineering construction company website template
The modern engineering and construction company website template is a downloadable website template suitable for promotion of the engineering and construction service industry. Tip: This template calls the Google font library, and the page may open slowly.
Front-end template
2024-02-28

