
current location:Home > Technical Articles > Web Front-end
- Direction:
- All web3.0 Backend Development Web Front-end Database Operation and Maintenance Development Tools PHP Framework Common Problem Other Tech CMS Tutorial Java System Tutorial Computer Tutorials Hardware Tutorial Mobile Tutorial Software Tutorial Mobile Game Tutorial
- Classify:


-

- How to use echarts for bootstrap
- How to use Bootstrap with ECharts To integrate Bootstrap with ECharts, you can follow these steps: Install the Bootstrap and the ECharts library. Create a chart container. Initialize an ECharts instance. Set chart options. Call render() method to render the chart. Advantages of using Bootstrap and ECharts: Responsive design custom style interactive data visualization
- Bootstrap Tutorial . echarts 161 2025-04-07 13:30:02
-
- How to solve the problem that the second label of the dual x-axis in echarts is not displayed by adjusting the series configuration?
- How to solve the problem of the second label of the dual x-axis not displaying in echarts? When using echarts for data visualization, you may encounter setting the double x-axis, the second...
- CSS Tutorial . echarts 926 2025-04-05 21:30:01
-
- In the field of data display, how to quickly build beautiful and powerful static pages?
- How to implement static pages for data display In the field of data display, how to quickly build a beautiful and powerful static page is a concern for many developers...
- CSS Tutorial . echarts 232 2025-04-05 20:39:01
-
- How to achieve the effect of ring progress bars in Ant Design Vue?
- Many front-end novices use AntDesignVue (antdv) to achieve the effect of ring progress bars...
- CSS Tutorial . echarts 922 2025-04-05 20:15:01
-
- From UI design draft to front-end implementation: How to start writing code and deal with ECharts chart details?
- From UI design draft to front-end implementation: How to start writing code? When you get the Blue Lake design draft provided by the UI designer, the front-end developers need to...
- CSS Tutorial . echarts 243 2025-04-05 19:51:01
-
- How to solve the problem that the second X-axis label is not displayed in ECharts?
- Solution to the problem that the second axis label does not display in ECharts dual X-axis settings. When using ECharts to draw performance analysis diagrams, you often encounter the need to set up dual X��...
- CSS Tutorial . echarts 1014 2025-04-05 17:33:01
-
- How to efficiently generate high-definition video or GIF animation based on ECharts charts using JavaScript?
- Methods for generating high-definition videos based on ECharts charts This article will explore how to use dynamic charts generated based on ECharts (such as columns that support dynamic sorting...
- CSS Tutorial . echarts 868 2025-04-05 16:12:01
-
- How to implement ring progress maps in Ant Design Vue?
- Based on AntDesignVue, many front-end novice use AntDesignVue (antdv)...
- CSS Tutorial . echarts 646 2025-04-05 14:24:01
-
- How to solve the problem that the second X-axis label in ECharts dual X-axis chart is not displayed?
- When drawing a dual X-axis chart using ECharts, you sometimes encounter the problem that the labels on the second X-axis cannot be displayed. This article will introduce how to adjust the configuration...
- CSS Tutorial . echarts 261 2025-04-05 14:00:06
-
- How to make sure the label of the second X-axis in ECharts dual X-axis is visible?
- How to make sure the label of the second X-axis is visible when using ECharts dual X-axis? When using ECharts for data visualization, you often encounter the need to use dual X-axis...
- HTML Tutorial . echarts 978 2025-04-05 11:30:01
-
- How to modify the color of the text in the center of the ECharts ring chart?
- Customize the text color of the center of the ECharts ring chart. When drawing a ring chart using ECharts, you often need to style the text in the middle of the ring chart, such as...
- HTML Tutorial . echarts 754 2025-04-05 10:09:01
-
- How to get the specific data of a pie chart through Echarts' getZr().on('click') method?
- How to get the specific data of a pie chart through getZr().on('click') in Echarts? When creating pie charts using Echarts, many developers will encounter using getZr().on('...
- HTML Tutorial . echarts 271 2025-04-05 08:24:01
-
- How to draw cool glowing 3D charts with ECharts?
- ECharts...
- HTML Tutorial . echarts 822 2025-04-04 22:42:01
-
- How to achieve cool 3D luminous chart effects using ECharts?
- ECharts...
- HTML Tutorial . echarts 698 2025-04-04 22:09:01
-
- How to accurately display floating point calculation results in ECharts bar charts?
- Floating point display accuracy control in ECharts bar charts When using ECharts to draw bar charts, numerical results are often required. However, due to JavaScript floating point...
- JS Tutorial . echarts 567 2025-04-04 18:15:01


Tool Recommendations
jQuery enterprise message form contact code
jQuery enterprise message form contact code is a simple and practical enterprise message form and contact us introduction page code.
form button
2024-02-29

HTML5 MP3 music box playback effects
HTML5 MP3 music box playback special effect is an mp3 music player based on HTML5 css3 to create cute music box emoticons and click the switch button.
Player special effects
2024-02-29

HTML5 cool particle animation navigation menu special effects
HTML5 cool particle animation navigation menu special effect is a special effect that changes color when the navigation menu is hovered by the mouse.
Menu navigation
2024-02-29
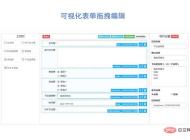
jQuery visual form drag and drop editing code
jQuery visual form drag and drop editing code is a visual form based on jQuery and bootstrap framework.
form button
2024-02-29

Organic fruit and vegetable supplier web template Bootstrap5
An organic fruit and vegetable supplier web template-Bootstrap5
Bootstrap template
2023-02-03
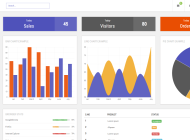
Bootstrap3 multifunctional data information background management responsive web page template-Novus
Bootstrap3 multifunctional data information background management responsive web page template-Novus
backend template
2023-02-02

Real estate resource service platform web page template Bootstrap5
Real estate resource service platform web page template Bootstrap5
Bootstrap template
2023-02-02

Simple resume information web template Bootstrap4
Simple resume information web template Bootstrap4
Bootstrap template
2023-02-02
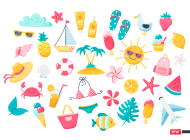
Cute summer elements vector material (EPS PNG)
This is a cute summer element vector material, including the sun, sun hat, coconut tree, bikini, airplane, watermelon, ice cream, ice cream, cold drink, swimming ring, flip-flops, pineapple, conch, shell, starfish, crab, Lemons, sunscreen, sunglasses, etc., the materials are provided in EPS and PNG formats, including JPG previews.
PNG material
2024-05-09
Four red 2023 graduation badges vector material (AI EPS PNG)
This is a red 2023 graduation badge vector material, four in total, available in AI, EPS and PNG formats, including JPG preview.
PNG material
2024-02-29

Singing bird and cart filled with flowers design spring banner vector material (AI EPS)
This is a spring banner vector material designed with singing birds and a cart full of flowers. It is available in AI and EPS formats, including JPG preview.
banner picture
2024-02-29

Golden graduation cap vector material (EPS PNG)
This is a golden graduation cap vector material, available in EPS and PNG formats, including JPG preview.
PNG material
2024-02-27
Home Decor Cleaning and Repair Service Company Website Template
Home Decoration Cleaning and Maintenance Service Company Website Template is a website template download suitable for promotional websites that provide home decoration, cleaning, maintenance and other service organizations. Tip: This template calls the Google font library, and the page may open slowly.
Front-end template
2024-05-09
Fresh color personal resume guide page template
Fresh color matching personal job application resume guide page template is a personal job search resume work display guide page web template download suitable for fresh color matching style. Tip: This template calls the Google font library, and the page may open slowly.
Front-end template
2024-02-29
Designer Creative Job Resume Web Template
Designer Creative Job Resume Web Template is a downloadable web template for personal job resume display suitable for various designer positions. Tip: This template calls the Google font library, and the page may open slowly.
Front-end template
2024-02-28

Modern engineering construction company website template
The modern engineering and construction company website template is a downloadable website template suitable for promotion of the engineering and construction service industry. Tip: This template calls the Google font library, and the page may open slowly.
Front-end template
2024-02-28

